 Back to Torrens
Causes of premature and potentially avoidable death; identifying hotspots of inequality
A Geographic and Temporal Analysis
Published: 2021
Purpose of the project
The number of deaths in general and by specific cause are indicators of a population’s health and safety. As a population health measure, areas with consistently higher death rates demonstrate areas of inequality and this phenomenon can be deeply entrenched over time. The availability of a long-term archive of death records and the consistent recording of the residential location within these files has meant that the degree of geographic and temporal variation in the causes of death can now be examined at the small area level across Australia.
Reporting on the variation over time is usually done by direct age-standardisation to calculate age-standardised death rates. However, when calculating age-standardised rates, the occurrence of small numbers, both in terms of the number of deaths and populations within each age-group in a small area, means that the rates can be erroneously inflated. This approach becomes problematic when we want to identify small areas that consistently have high death rates as areas that warrant intervention. To overcome this issue, we implemented the Empirical Bayes estimation method, within the age-standardisation process, to estimate death rates at the small area level from 2009 to 2018, across Australia. This approach minimises the effects of statistical issues in the calculation of the age-standardised death rates by weighing the death rate of a small area together with the death rates from all areas under investigation.
Hotspot analysis was then undertaken on this multi-dimensional dataset highlighting the heat of each area, from "Cold" to "Hot", in relation to the area’s annual death rate compared to the annual Australian average. We have focused on the premature and potentially avoidable death categories from which a total of 26 cause of death indicators were investigated.
We hope that this new analysis, and its presentation in geographical maps, heat map graphs and data sheets, will provide information that is useful to the various levels of the health system, from state and territory health agencies, local and regional health networks and boards, PHN and primary care practitioners, with an aim to work together to reduce the level of premature and potentially avoidable deaths in Australia. The interpretation of the data and its presentation is complex, and we encourage users to read the detailed notes below, and, to take note of the document on Using the Atlas.
Further information can be obtained by contacting the Public Health Information Development Unit.
Summary notes on the premature and potentially avoidable death cause of death categories
The premature causes of death and the potentially avoidable causes of deathatlases and corresponding data show the geographic and temporal variations in rates of premature or potentially avoidable death categories. The analysis is described in detail below, but, in brief, each Population Health Area (PHA) is classified based on their annual death rates compared to the population weighted Australian average as being "Cold", "Cold-Warm", "Warm", "Warm-Hot" or "Hot". These classes can be viewed at different thresholds; for example, is the area “Hot” when compared with the average rate of death across Australia for a particular cause of death across the ten years? Or is it still “Hot”, when we change the threshold to a level 20% above the Australian rate?
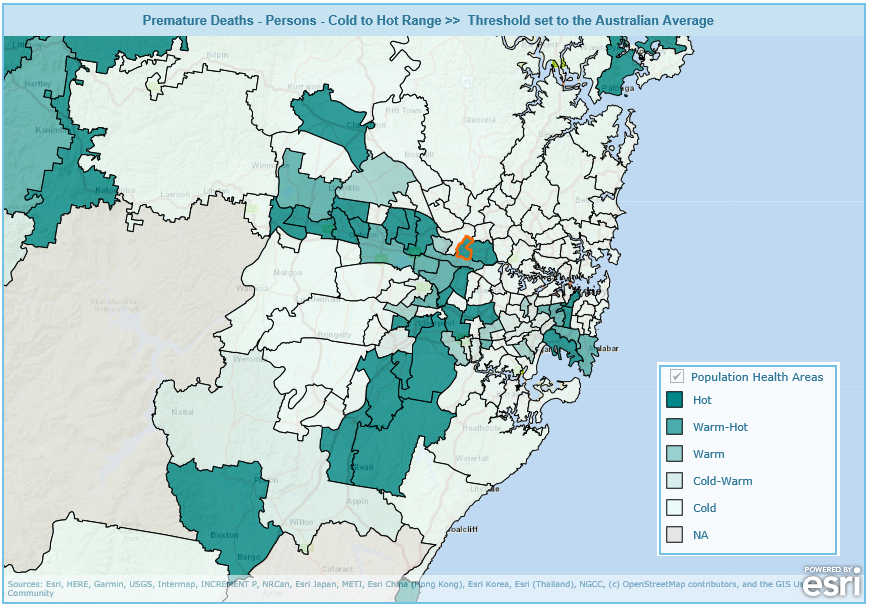
By providing a selection of thresholds, we can investigate the persistence of these classes in different PHAs over time. This can be done both between (geographic variation) and within (temporal variation) PHAs. Specifically, the atlases show the geographic variation across Australia for all death categories. Figure 1 provides an example showing the geographic variation in the heat of the Premature Death - Persons category when death rates are compared to the Australian average across small areas in the greater Sydney region of New South Wales. The figure shows that there are areas which persistently have death rates both over and under this threshold (classified as "Cold" or "Hot").
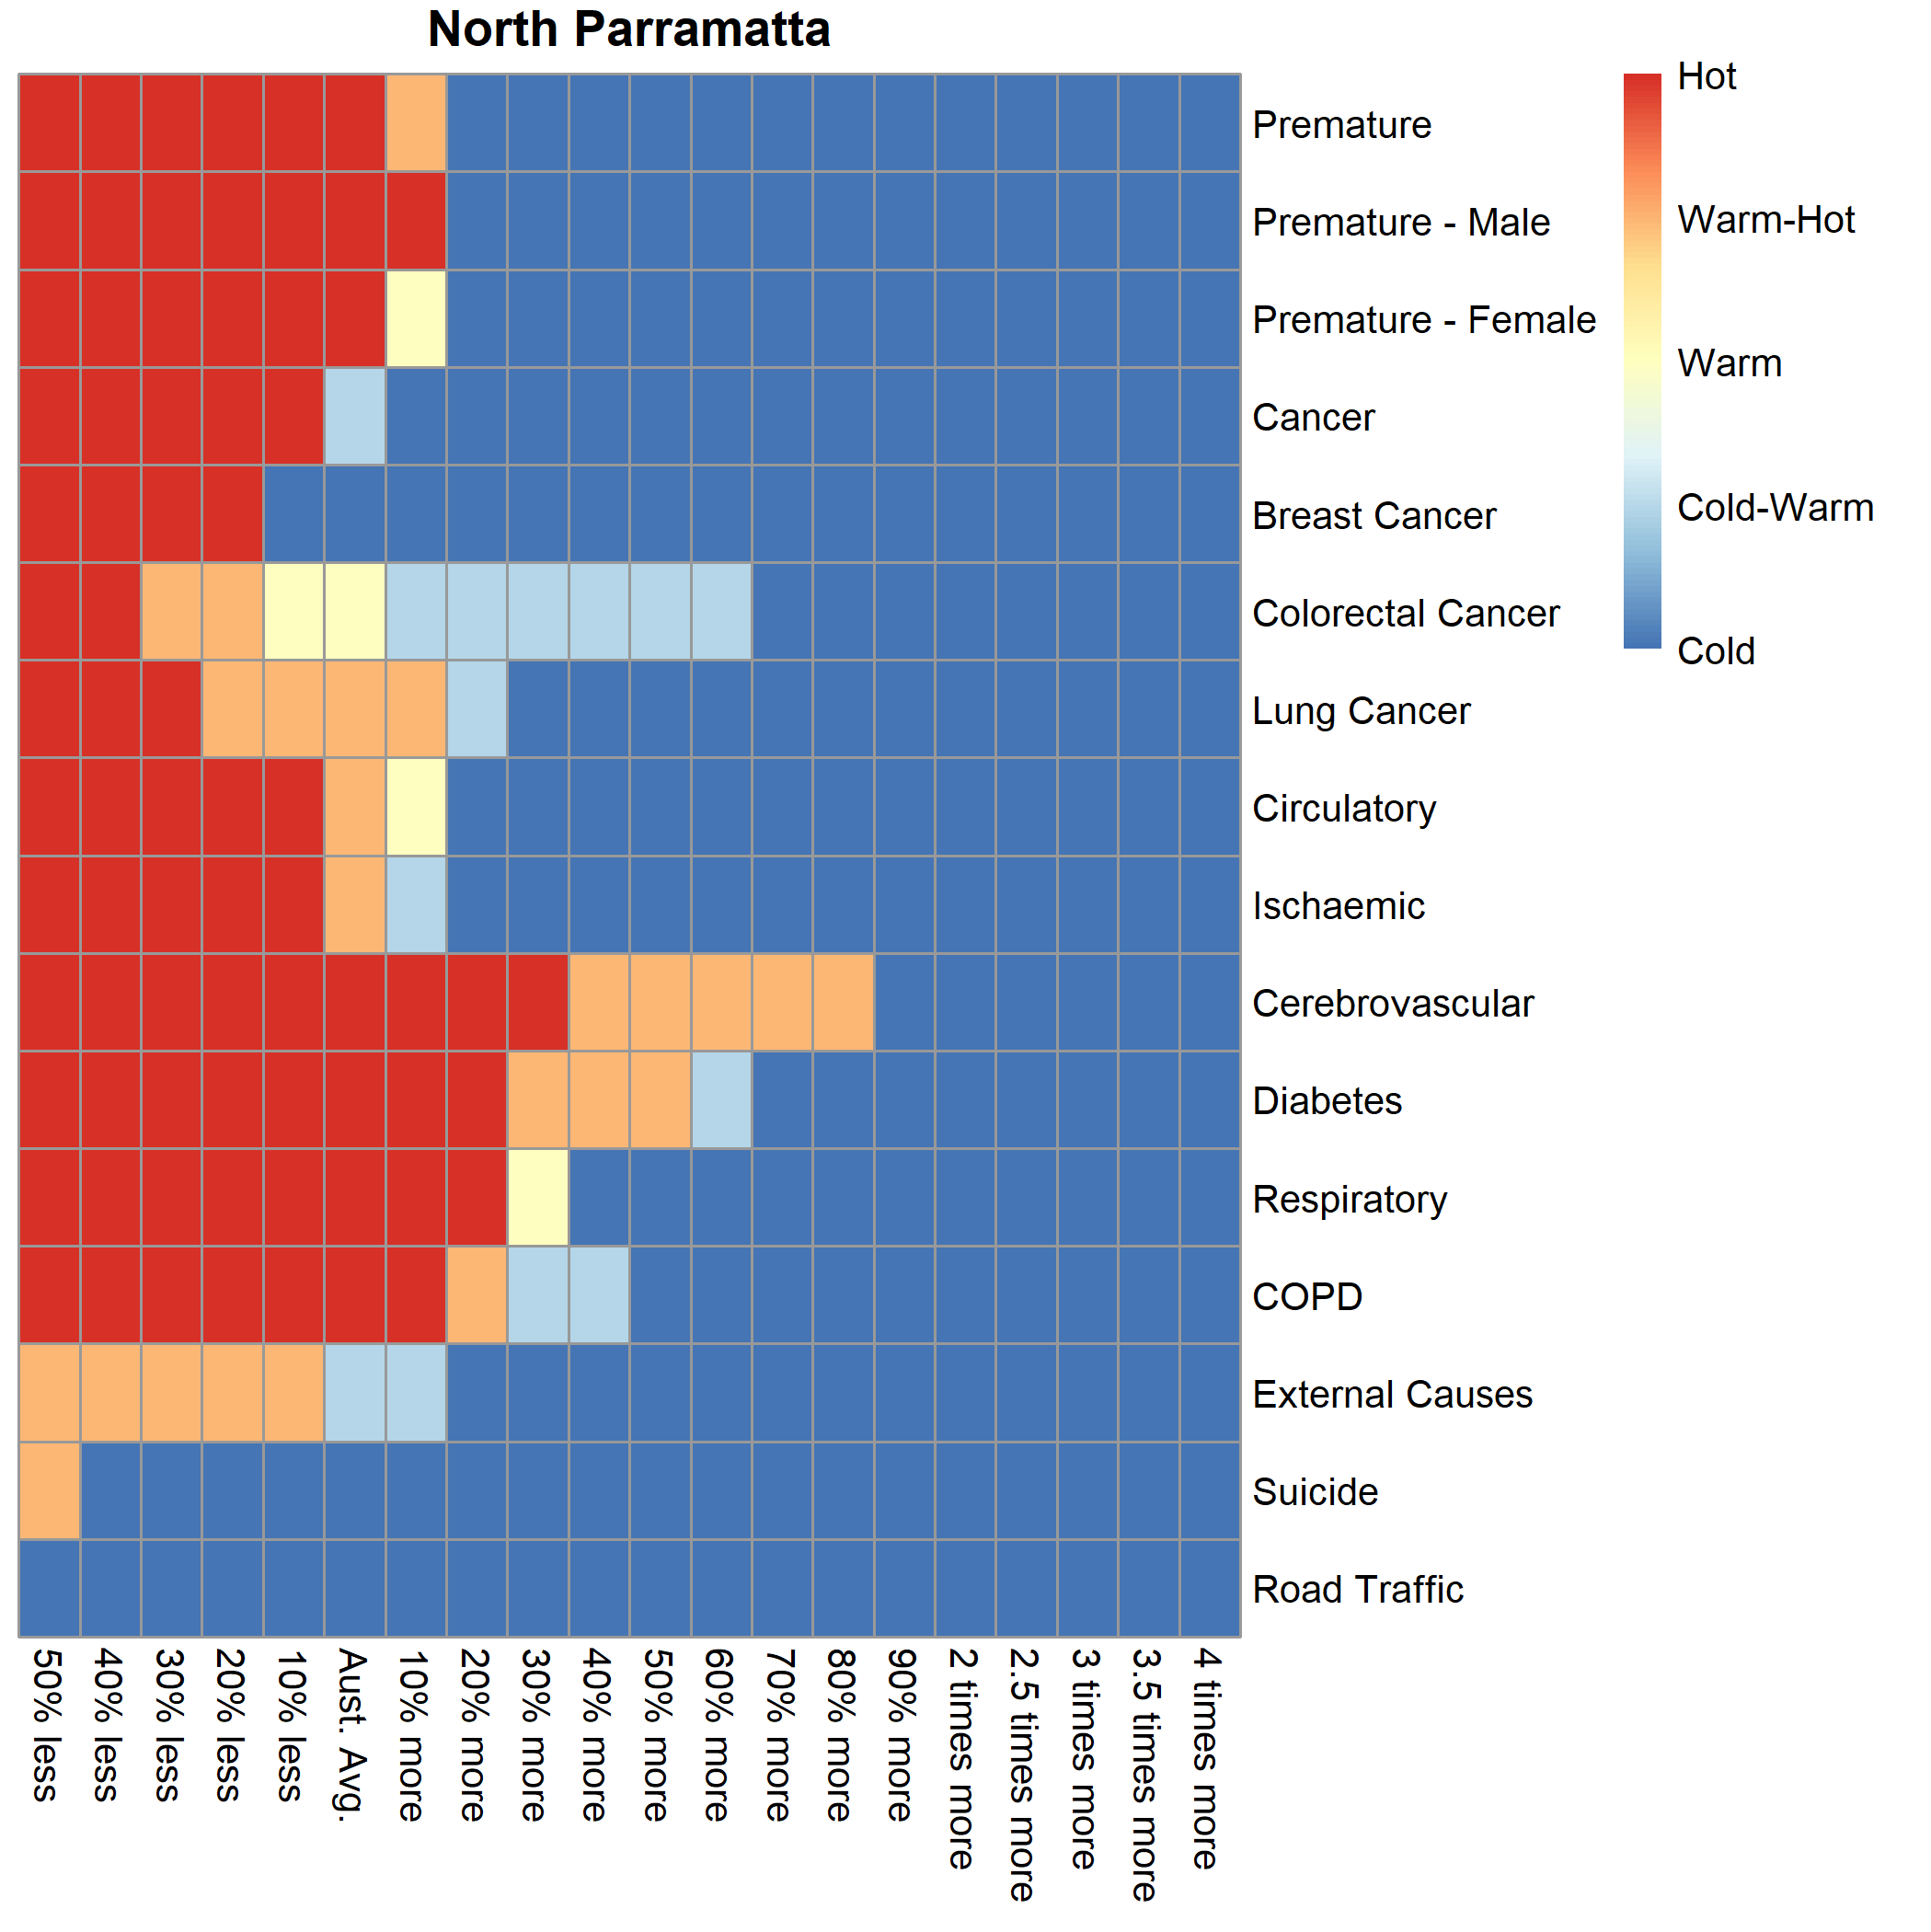
In addition, the variations in heat over the ten-year period within each PHA can be investigated by cause of death using the heat map graphs. For example, we have selected the North Parramatta PHA (Figure 2). The graph shows the range of heat for particular causes of death for the series of selected thresholds. Deaths from Diabetes, Respiratory and Cerebrovascular disease were designated as "Hot" when the threshold was set to 20% more than the Australian average for each cause. The graphs can also be used to compare the magnitude of the causes of death between PHAs.
Analysing the temporal trend of the premature and potentially avoidable death categories provides an overview of the distribution of the overall rates of premature and potentially avoidable deaths in Australia. It is worth noting that these categories are an aggregate of individual causes of death. This suggests that, once this complexity is unpacked, different strategies will need to be implemented to effect change. We must also highlight that when specific causes are investigated, the number of deaths by PHA may be small. Thus, we suggest that you use these data with caution; it may also be useful to refer to the number of deaths in any PHA, available in the premature causes of death or the potentially avoidable causes of deathatlases and in the corresponding data..
Background and aim of the project
There is a long history into the investigation of mortality rates in Australia (Turrell et al., 2001; Turrell et al., 2006; Cramb et al., 2012; Lopez and Adair, 2019). Very early on Turrell et al., 2001 reported that the mortality burden in the Australian population attributable to socioeconomic inequality was large. This burden has profound and far-reaching implications in terms of the unnecessary loss of life, the loss of potentially economically productive members of society and increased costs for the health care system. As time has progressed, research has shown that this burden has an entrenched geographical persistence over time (Draper et al., 2004, AIHW, 2014; Adair and Lopez, 2020).
Of concern is the death of people under 75 years of age, known as premature death. Investigations into how premature death rates are tracking over time has found that from 1981 to 2003, Australia’s life expectancy at birth has increased rapidly but these increases have slowed since 2003 (Lopez and Adair, 2019). Nested within these rates and of growing concern, is that the death rates for causes of death that can be avoided in young Australian women, have not improved since 2010 (Rawlings et al., 2019). A major conclusion of these studies is that there has been a decrease in the absolute gap in mortality (magnitude of rates) but a widening of the relative differences of mortality rate between people living in the most advantaged and most disadvantaged areas. This phenomenon has been shown for premature deaths (Lopez and Adair, 2019) and those that have been deemed avoidable (Korda et al., 2007). While socioeconomic status is a main driver, other factors such as the cause of death, age, remoteness of area of residence (Chondur et al., 2014) and indigenous status (Wilson et al., 2019) also influence this inequality in the rates of death.
A recent publication by Adair and Lopez, 2020 report, that death rates for non-communicable diseases in the 35-74 years age-group were:
- nearly double for people living in the most disadvantaged areas when compared to the most advantaged in 2016. This ratio has increased since 2011.
- 16% and 21% higher for males and females living in inner regional areas and 21% and 39% higher for males and females living in outer regional/remote and very remote areas when compared to males and females living in major cities.
Furthermore, death rates also differed by cause of death where:
- Cardiovascular disease, ischaemic heart disease, diabetes and total cancers were 2.67, 3.43, 4.05, 1.54 times higher in the most disadvantaged areas when compared to the most advantaged in 2016. These ratios have all increased since 2011.
- Cardiovascular diseases were 1.13 and 1.17 times higher for males and females living in inner regional areas and 1.52 and 1.69 higher for males and females living in outer regional/remote and very remote areas when compared to males and females living in major cities.
- Ischaemic heart diseases were 1.16 and 1.19 times higher for males and females living in inner regional areas and 1.65 and 2.01 times higher for males and females living in outer regional/remote and very remote areas when compared to males and females living in major cities.
- Diabetes were 1.09 and 1.06 times higher for males and females living in inner regional areas and 1.72 and 3.20 times higher for males and females living in outer regional/remote and very remote areas when compared to males and females living in major cities.
- Total cancers were 1.16 and 1.20 times higher for males and females living in inner regional areas and 1.28 and 1.21 times higher for males and females living in outer regional/remote and very remote areas when compared to males and females living in major cities.
These results mirror the historical socioeconomic and remoteness trends in Australian deaths published by the Public Health Information Development Unit (PHIDU) within the Social Health Atlas (PHIDU, 2021).
The significant variation in inequalities at broad socioeconomic and remoteness categories has prompted a more geographically focused approach to understanding the inequalities in the death rate. This approach has meant that the majority of work has focused on a specific cause of death or aggregated categories of death. For example, Cheung et al., 2012 and Qi et al., 2014 used small area level data to pinpoint the spatial patterns of suicide while Duncan et al., 2019 investigated the geographic variation in the relative survival from numerous types of cancers at the small area level. These studies complement the published trends of death rates by multiple causes across Australia at the small area level (PHIDU,2021). Quantifying the geographic variation in avoidable deaths in New South Wales regional areas, Slimings and Moore, 2020 report that the striking differences were not solely due to remoteness. They report the need for targeted interventions in specific local government areas, specifically to improve the equity of access to health care in remote areas. These statements echo more generalised conclusions proposing that policies and interventions to reduce mortality inequalities should focus on places as well as people (Turrell et al., 2006).
The identification of place, as a contributing factor, recognises that the variation of death rates is influenced by a range of interdependent factors. Place reflects the complex social, environmental and behavioural factors of people that live there with geographical access to health care being not the only issue (Dasgupta et al., 2019). The health of a population living within a place(s) is influenced by overarching government policies. Policies focusing on housing (Thomson et al., 2013), income (Richardson et al., 2020), and neighborhood renewal (Feldman et al., 2009; Kelaher et al., 2010) have been shown to reduce variations in health status of the place-based population. Where focus is placed on area-based health care, place(s) can reflect the nature of primary care and the performance of the health system to address the health needs of people living there (Slimings and Moore, 2020). Interventions to address service variations have focused on access (Richard et al., 2016), quality (Peterson et al., 2019) and continuity of care (Hofer and McDonald, 2019). Overall, Durie and Wyatt, 2013 report that underlying health problems are complex which have many casual pathways and as a result will require locally tailored interventions. This will involve multiple service providers working with local communities recognising that systemic change cannot be externally directed but occurs as a result of the self-organising interactions and relationships within the system.
The current slowdown in gains in reducing the death rate made by current public health policy, the significant geographic inequalities of mortality and the persistent call for locally tailored interventions warrant a more in-depth investigation into, not only the geographic variation, but the temporal persistence of mortality across Australia.
Aim of the project
This study focuses on creating a ten-year baseline of the geographic variation and temporal persistence of the causes of premature and potentially avoidable deaths at the small area level across Australia. The project follows on from the previous PHIDU analysis of Potentially Preventable Hospitalisations for the Australian and Indigenous populations drawing on the work undertaken by Duckett and Griffiths (2016) published as “Perils of Place: identifying hotspots of health inequalities”. Visualisation of the information created will enhance our shared understanding of the geographic variation and temporal persistence of premature and potentially avoidable deaths and provide an evidence base which can be used to plan actions and policy reform to influence health outcomes at the area level across Australia.
Death as an indicator of small area level health
The number of deaths by cause are indicators of a population’s health and safety. Examining the patterns of death can help explain differences and changes in health status, evaluate health strategies and guide planning and policy-making (AIHW, 2020). Compilation of the indicators also allows the multiple facets of the health care system to be investigated, such as the delivery of care in different settings (Page et al., 2006).
There are two areas of focus in relation to deaths in Australia; the premature death and potentially avoidable death categories.
Premature deaths
Quantifying the magnitude, variation and the causes of premature death, deaths before the age of 75, have implications for public health policy in terms of priority setting, monitoring and policy development. The loss in the potential years of life for premature death in Australia has been estimated at 871,807 years or 37 years per 1,000 population in 2018 (AIHW, 2020). The impacts of premature death on society are therefore substantial with significant economic consequences. Carter et al., 2017 estimated that in Australia about 284,000 working years and $13.8 billion in lifetime income was lost due to premature deaths occurring in 2003. They report that deaths from cancer and cardiovascular disease accounted for more than half the lifetime income lost while injuries and mental disorders were associated with the highest average loss per death. These significant costs are also apparent internationally, compelling the United Nations to set a key international public health goal ( Sustainable Development Goal 3.4) to reduce premature mortality by a third for non-communicable diseases by 2030.
The premature deaths indicator
The premature death indicator refers to deaths among people younger than 75 years. This cut-off age group produces conservative estimates of premature mortality because it represents deaths that occur at an age lower than the median age of death (78.8 years for males and 84.8 years for females (ABS, 2020) and life expectancy at birth (80.9 years for males and 85.0 for females between 2017 and 2019) (ABS, 2020a). Premature deaths represented just over 54,000 deaths in 2018, which equated to 34% of all deaths in Australia (n=158,493). Cancer, diseases of the circulatory system and the combined external causes of accidents, poisonings and violence were the main causes of premature death in Australia in 2018 (AIHW, 2020a).
Premature deaths are reported in numerous ways, as a single category (by persons), by sex (male and female) and also by specific cause of death. Within the Social Health Atlas(PHIDU, 2021), PHIDU releases premature death data on cancer deaths as a total or by specific types of cancer; colorectal, lung, and female breast cancer. Other causes of death are reported in relation to circulatory system diseases, ischaemic heart disease, cerebrovascular disease, diabetes, respiratory system disease, chronic obstructive pulmonary disease, external causes, road traffic injuries, and suicide and self-inflicted injuries.
Potentially avoidable deaths
Potentially avoidable deaths, also referred to as avoidable mortality, are a subset of the premature death category (deaths under 75 years). They are used as a performance indicator for the effectiveness of the health system, including hospital, primary and community care (Falster and Jorm, 2017). While a primary measure for health system effectiveness, it is also used for measuring improvements to health standards and primary care which lead to fewer deaths.
Over 26,000 potentially avoidable deaths occurred in Australia in 2018 at an age-standardised rate of 100.3 deaths per 100,000 persons. Around 50% and 46.9% of all premature deaths for males and females were classified as potentially avoidable in 2018 (AIHW, 2020).
In their publication “A guide to the potentially avoidable deaths indicator in Australia” (Falster and Jorm, 2017), report that potentially avoidable deaths can be used for comparisons between geographic regions, be broken down by cause of death and by population subgroups, and used to show trends over time. They report that this information can be used to identify priorities for targeted policy interventions as well as to monitor for improvements or identify emerging problem areas in the health system.
The potentially avoidable death indicator
A potentially avoidable death is a death from conditions that are potentially preventable (avoidable) through individualised care and/or treatable through existing primary or hospital care i.e. avoidable in the context of the present health system (AIHW, 2020b). They reflect a formal indicator measure using nationally agreed definitions based on the cause of death within Australian National Healthcare Agreement PI 16 – Potentially avoidable deaths, 2020 (AIHW, 2020a). Cause of death are defined by ICD-10 codes/specifications laid out in the current 2020 definition.
These codes are revised regularly by a panel of clinicians, policymakers and data experts to ensure that the measure remains relevant to Australian policy priorities, are reliable in its measurement, and are comparable between regions and over time. Conditions are reviewed according to both the relative volume of deaths and the presence of contemporary interventions shown to be capable of reducing mortality within five years (Falster and Jorm, 2017).
Methodology
Data
Death records
Death data was based on deaths occurring between 2009 to 2018 and was taken from the Causes of Death Unit Record Files supplied by the Australian Coordinating Registry and the Victorian Department of Justice, on behalf of the Registries of Births, Deaths and Marriages and the National Coronial Information System.
Population
Persons, male and female populations were taken from the Australian Bureau of Statistics (ABS) Estimated Resident Population (ERP) for June 2009 to June 2018 on the 2016 Australian Statistical Geography Standard geography at the Statistical Area Level 2 level (SA2).
Pre-processing of the data
Premature Deaths
Premature deaths, defined as deaths between zero and 74 years of age were extracted. Data were extracted for total premature deaths by males, females and persons as well as for specific causes of death. These causes were: all cancers, colorectal cancer, lung cancer, female breast cancer, diabetes, circulatory system diseases, ischaemic heart disease, cerebrovascular disease, respiratory system disease, chronic obstructive pulmonary disease, external causes, road traffic injuries, and suicide and self-inflicted injuries.
Potentially Avoidable Deaths
Potentially avoidable deaths, defined by ICD-10 cause of death codes within the National Healthcare Agreement: PI 16 – Potentially avoidable deaths 2020 (AIHW, 2020b) were extracted. These were: avoidable cancers, colorectal cancer, female breast cancer, diabetes, circulatory system diseases, ischaemic heart disease, cerebrovascular disease, respiratory system disease, chronic obstructive pulmonary disease, external causes, suicide and self-inflicted injuries, other external causes and transport accidents. Total avoidable death data was extracted for males, females and persons.
Setting the geography of the death data to the 2016 Australian Statistical Geography Standard
For the years 2009 to 2015, the residential location of the individual who died was coded to the Australian Bureau of Statistics (ABS) 2011 Australian Standard Geographical Classification geography at the Statistical Areas Level 2 (SA2) area unit. The number of deaths by SA2 for each death category was proportioned to the 2016 Australian Statistical Geography Standard using the ABS SA2 geographic correspondence file.
For the years 2016 to 2018, the published geography of the Causes of Death Unit Record Files was geocoded to the 2016 Australian Statistical Geography Standard. We calculated the total number of deaths for each SA2 for each premature and potentially avoidable death category.
The SA2s for all years and death categories were then corresponded to the PHIDU Population Health Area geography (PHA). PHAs are comprised of a combination of whole ABS defined SA2s and multiple (aggregates of) SA2s. Nearly 40% of PHAs are combined of one SA2, another 38% have two SA2s with the other 22% of PHAs comprising of multiple combinations of SA2s.
Extraction of death data by age-group
In order to directly age-standardise the rates of death, we broke the death datasets for each premature and potentially avoidable death category into seven age-groups categories (0-14 years old, 15-24 years old, 25-34 years old, 35-44 years old, 45-54 years old, 55-64 years old, 65-74 years old). The majority of these classification represent a ten-year time period. This ten-year time period has been deemed acceptable in the standardisation process with very little difference between age-standardised rates using either five-year or ten-year age groups (AIHW, 2011).
Merge with ABS Estimated Residential Population
Yearly death data by PHA geography and age-group for each premature and potentially avoidable death category was merged with the corresponding yearly ABS ERP by age group.
Using the Empirical Bayes process to calculate small area death rates
The calculation of crude or age-standardised mortality rates for small areas has the potential to produce large unreliable rates of mortality. This occurs when deaths are rare occurrences, such as for a specific cause of death or when they are collected over small time periods such as annually. The corresponding populations used in the process also pose an issue, with small age-specific populations within each PHA inflating the estimate of the age-standardised rate. Benach et al., 2003 suggests that the large heterogeneity in population size across areas leads to various levels of precision of area specific mortality risk estimates and that age-distribution differences across areas result in mortality risk estimates that are influenced by age effects. The outcome of these issues is that the wide variation of rates make comparison of rates across small areas difficult. For example, when locations of high population density are compared to ones with lower population densities, the calculated age-specific ratios do not reflect the relative sizes and relatively equal rates from these areas may in reality be quite different from each other (Türkan et al., 2020). Additionally, Yasaitis et al., 2015 suggests that there are calculation issues when an investigator wishes to explore local health phenomena where the populations are too small to create statistically stable estimates.
To minimize the potential fluctuations in mortality rates, the Empirical Bayes (EB) estimator has been proposed. Early studies (Tsutakawa et. al, 1985; Manton et al., 1989) used the EB methodology in small and moderate sized areas to obtain adjusted rates in cancer morality, reporting that these were more stable for comparison. Later studies have used extensions of this methodology to investigate geographic variation in premature mortality (Fukuda et al., 2004), area based standardised mortality ratios for rare occurrences of death such as suicide (Yamaoka et al., 2020), cardiovascular conditions (Rodrigues et al., 2015; Darikwa et al., 2019), Chagas’ disease (Martins-Melo et al., 2012), schistosomiasis-related mortality (Pinheiro et al., 2020), infant mortality (Türkan et al., 2020) and cancer (Agovino et al., 2018). The use of EB in the creation of atlases to map the geographic variation of mortality has also been significant. For example, Benach et al., 2003 used EB to estimate the small area age-adjusted relative risk for each cause/gender/age group combination of mortality to create the Spanish Atlas of Mortality. Pickle, 2009 describes its use for making small area maps of direct age-standardised death rates for multiple cancers across the United States, while Athens et al., 2013 used the methodology to rank the health status of counties by premature mortality and other population health measures in the United States. These atlases are an important tool for examining geographic patterns of mortality risk, identifying specific high-risk areas and providing an evidence base for health policy planning.
When we implement the Empirical Bayes methodology, the process weighs the information of the small area of interest together with the information from all areas under investigation (Benach et al., 2003). This involves the creation of a prior distribution of relative risks in the form of a probability density function where the prior distribution reflects prior beliefs about the distribution of relative risks and this is parameterized by hyperparameters (Leyland et al., 2005). The use of the hyperparameters smooths or shrinks the observed value, improving the estimate by borrowing strength from the values of all observations in order to produce more stable estimates. In practice, those areas with smaller populations will have their rates smoothed more or shrunk towards the mean more than areas with larger populations.
One criticism of the EB approach is that there is over shrinkage towards the mean with the result that the variance of a collection of EB estimates will underestimate the variance of the true rates (Leyland, 2005). The amount of shrinkage is determined by the extent of unreliability in the original data and the model assumed for the prior distribution of relative risk (Congdon 1994). The author suggests that suicide and less common causes, especially for areas with small populations are contexts where this type of analysis is appropriate. For larger populations and more common causes of death, shrinkage towards the mean diminishes and the need for adjustment by the EB methodology is reduced. Ugarte et al., 2009 qualifies this statement demonstrating with sensitivity analysis that while smoothing is the desirable property of the model, an excess of smoothing may hinder detection of high-risk areas. The reliability of the estimates is mostly dependent on the magnitude of the underlying risk and population. If the underlying risk is low and the population is sparse then smoothing may reduce the identification of true positives. Later analysis (Yasaitis et al., 2015) showed similar results where EB tended to adjust the values to the global mean with more sparsely populated areas adjusted more dramatically towards that mean. These studies suggest that the EB methodology is a very conservative approach to estimate mortality rates.
Number of premature and potentially avoidable deaths by cause of death and age-group from 2009 to 2018
Table 1 shows the distribution of deaths by age-group for each cause of death. The Premature category text prefix on the cause of death labels represent deaths between the ages of 0-74 years while the Avoidable category text prefix represents those deaths which have been identified as being potentially avoidable within 0-74 years. Causes of death with no labelled text prefix represents the number of deaths for both categories.
| Deaths | 0-14 | 15-24 | 25-34 | 35-44 | 45-54 | 55-64 | 65-74 | Grand Total |
| Premature - Persons | 15,093 | 11,405 | 18,551 | 33,305 | 69,286 | 133,955 | 233,115 | 514,710 |
| Avoidable – Persons | 8,147 | 8,838 | 14,070 | 21,844 | 37,305 | 62,556 | 109,025 | 261,785 |
| Premature – Males | 8,458 | 8,019 | 12,894 | 21,214 | 42,260 | 82,937 | 143,014 | 318,796 |
| Avoidable – Males | 4,629 | 6,490 | 10,185 | 14,470 | 22,890 | 39,034 | 68,545 | 166,243 |
| Premature -Females | 6,597 | 3,360 | 5,632 | 12,048 | 27,004 | 51,005 | 90,104 | 195,750 |
| Avoidable - Females | 3,494 | 2,331 | 3,855 | 7,350 | 14,366 | 23,494 | 40,467 | 95,357 |
| Premature Cancer | 969 | 1,008 | 2,613 | 8,254 | 27,215 | 66,369 | 110,673 | 217,101 |
| Avoidable - Cancer | 133 | 227 | 1,130 | 3,530 | 9,583 | 19,912 | 31,667 | 66,182 |
| Premature Colorectal Cancer | 0 | 36 | 356 | 856 | 2,577 | 6,003 | 9,634 | 19,462 |
| Avoidable Colorectal Cancer | 0 | 39 | 408 | 963 | 3,006 | 7,016 | 11,555 | 22,987 |
| Premature Lung Cancer | 6 | 7 | 90 | 740 | 4,543 | 14,063 | 25,446 | 44,895 |
| Female Breast Cancer | 0 | 5 | 223 | 1,320 | 3,743 | 5,678 | 6,225 | 17,194 |
| Diabetes | 11 | 61 | 222 | 524 | 1,521 | 3,586 | 7,510 | 13,435 |
| Premature - Circulatory | 380 | 494 | 1,445 | 4,900 | 13,052 | 25,927 | 49,977 | 96,175 |
| Avoidable – Circulatory | 127 | 219 | 914 | 3,560 | 10,567 | 21,471 | 41,542 | 78,400 |
| Ischaemic Heart Disease | 5 | 53 | 456 | 2,203 | 7,166 | 14,785 | 25,623 | 50,291 |
| Cerebrovascular | 72 | 79 | 210 | 795 | 2,179 | 4,168 | 10,086 | 17,589 |
| Premature - Respiratory | 458 | 201 | 380 | 880 | 2,547 | 7,558 | 20,987 | 33,011 |
| Avoidable - Respiratory | 97 | 84 | 139 | 328 | 1,360 | 4,936 | 13,947 | 20,891 |
| Chronic Obstructive Pulmonary Disease (COPD) | 12 | 4 | 23 | 143 | 1,053 | 4,566 | 13,485 | 19,286 |
| Premature External Causes | 1,847 | 8,098 | 11,300 | 13,004 | 12,488 | 9,424 | 7,531 | 63,692 |
| Avoidable External Causes | 287 | 3,769 | 5,058 | 5,769 | 5,914 | 4,778 | 4,110 | 29,685 |
| Avoidable - Other External Causes | 1,205 | 4,421 | 6,177 | 6,554 | 6,088 | 4,475 | 3,035 | 31,955 |
| Suicide | 168 | 3,574 | 4,875 | 5,448 | 5,286 | 3,695 | 2,045 | 25,091 |
| Premature - Road Traffic Injuries | 580 | 3,006 | 2,894 | 2,793 | 2,526 | 2,032 | 1,612 | 15,443 |
| Avoidable - Transport Accidents | 625 | 2,727 | 2,299 | 2,016 | 1,865 | 1,622 | 1,297 | 12,451 |
Estimating a prior from the dataset for each age-group and cause of death category
Traditionally, the rate of death of an area (PHA) is defined as an age-standardised rate, standardised to the 2001 standard population. This considers that the relative risks of death for specific causes differ with different ages. This calculation uses the relative risk, calculated as the number of deaths divided by the population in each age-group. These relative risks are standardised to the 2001 standard population by a ratio of the 2001 age group to the total 2001 population. The age-group rates are then summed over all age groups to create an overall aggregated age-standardised rate of death for a cause of death in a PHA. The number of deaths, the size of the populations and how these are distributed over the seven age-groups within the PHA will therefore influence the PHA age-standardised rate of mortality. The mortality rate per PHA is defined as the number of deaths per 100,000 population in a calendar year.
In order to take into account the relative risks of death at different ages on the calculation of mortality rates, we used the ebbr package (Robinson, 2017) utilising Empirical Bayes estimation to estimate the age standardised rates of mortality for the selected range of premature and potentially avoidable death datasets. We ran the package separately on each of the seven age groups for each cause of death aggregated over the ten years assuming the distribution followed a binomial likelihood function. This meant that each age-group had 1,165 observations, the number of PHAs in Australia, holding the ten-year aggregate of deaths and populations for each PHA. The distributions included PHA’s where no deaths were reported. The reports of zero deaths were more frequent in younger age-groups where the cause of death was less likely.
Gao and Dong, 2020 describe the relationship as:
Y ~ Binomial (θ, N)
Where Y is the observed number of deaths, θ is the unknown prevalence and N is the population size. θ is the unknown parameter whose values we assume to be modelled using a Beta probability distribution. While there has been differences found in the estimation of cancer mortality under different assumptions in describing the prior distributions of death (Mollie et al., 1991), the Beta probability distribution assumption has been used by several studies in mortality modelling (Andreopoulos et al., 2019; Gao and Dong, 2020). This distribution has the advantages of flexibility in the fitting of models and in modelling data such as death rates (number of deaths/population) with values between 0 and 1.
A specific Beta prior for each age-group over the ten years of data is then calculated by:
θ ~ Beta (α, β)
The Beta distribution has two shapes; α (Alpha) and β (Beta) whose values represent different degrees of prior knowledge on the likely values of θ. Alpha and Beta are called the hyperparameters of the model and can be calculated from the most likely values estimated using Maximum Likelihood Estimation.
The issue of low numbers of deaths in the EB calculation
The estimation of the hyperparameters (α and β) for each cause of death is determined from the number of deaths and the magnitude of the population, summed over a ten-year period, that occurs in each PHA within each age-group. For younger age-groups, the number of deaths is small especially for some causes of death when reported by PHA. Methodologically, the occurrence of low numbers of deaths poses issues in the calculation of the Beta distribution in the ebbr package. In order to run the EB algorithm there needs to be a minimum number of total deaths across all PHAs for the algorithm to work. A sensitivity analysis was undertaken which estimated the minimum number of total deaths to be 44 deaths within each age group category. Where deaths were lower than this number, say for breast, lung or colorectal cancer in the 15-24 years old category (Table 1), we flagged the records and used the crude death rate instead of the EB fitted death rate for the age-group category. Where the number of deaths were greater than 44 deaths in an age group, the algorithm fitted a Beta distribution to the data.
Worked examples of the EB calculation to estimate age-standardised death rates for the years 2009 to 2018
Step 1 Estimation of the prior probabilities
We ran the ebbr package on each of the seven age-group categories for the Premature – Persons death category. Figure 3 to Figure 5 show the Beta distributions and density plots for the 0-14, 15-24 and 25-34 years of age categories. In these younger age-categories where the rates of death are lower when compared to older ages, the dynamics of the Beta distributions can be characterized as tall and peaked with low EB fitted mean crude death rates (the dashed line). These dynamics highlight the existence of a small number of PHAs with either single or a small number of multiple deaths, large ten-year aggregated populations, and the existence of small variations in death rates between PHAs.
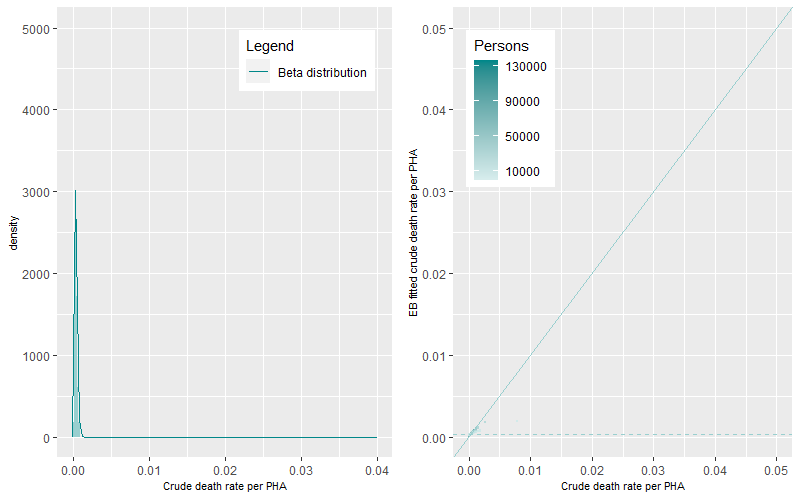

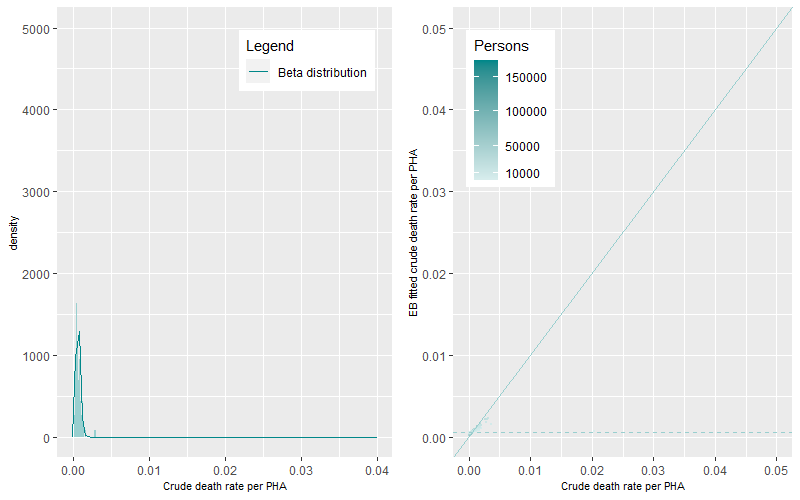
At older age-groups, higher numbers of deaths occur within sometimes smaller aggregated ten-year populations. This generates a greater magnitude and statistical range of death rates within and between PHAs generating flatter and wider Beta distributions (Figure 6 to Figure 9).
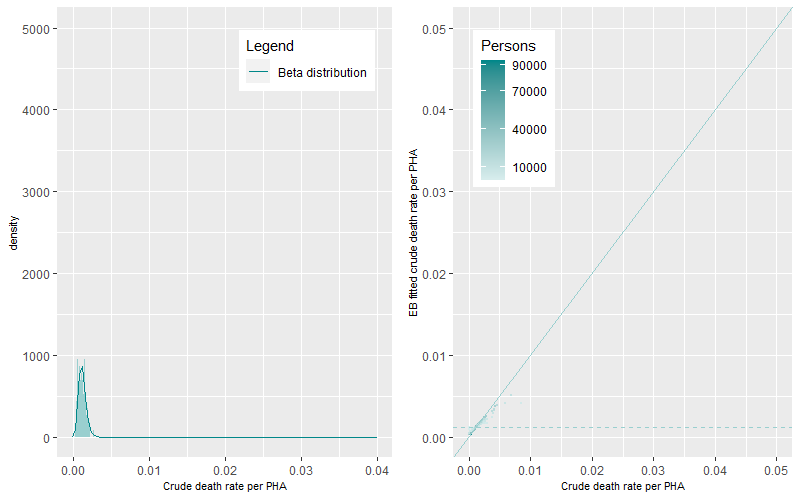
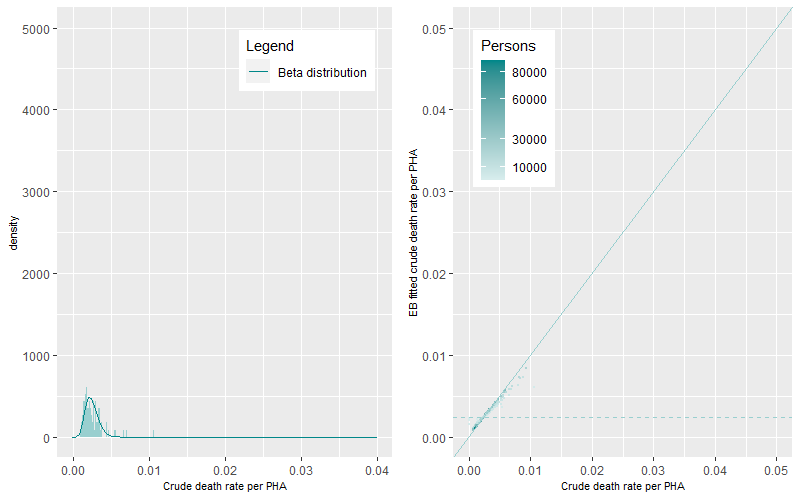
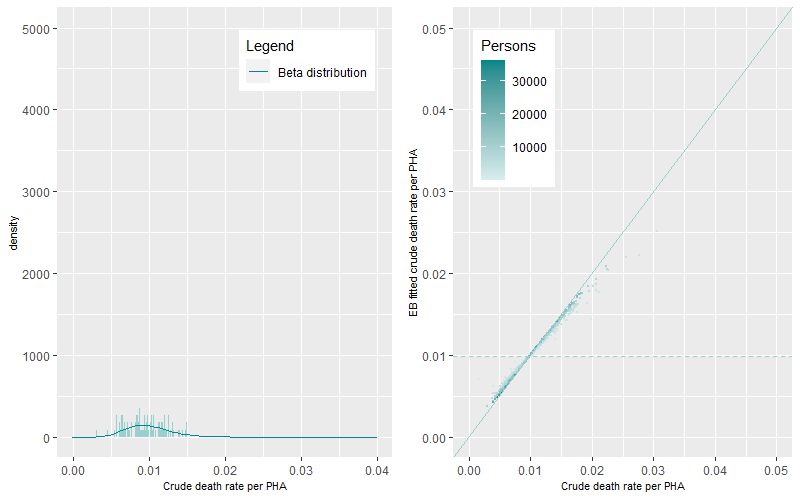
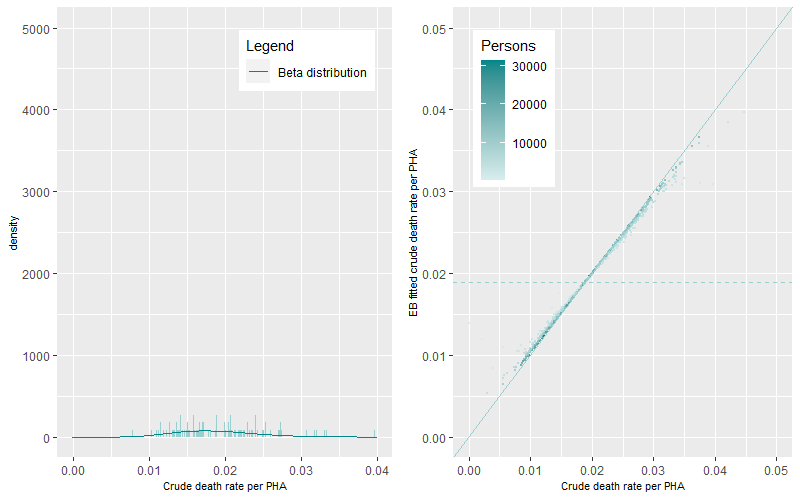
The prevalence of death rates differs by age-group. The differences between EB fitted crude death rates and the crude death rates are shown in Figure 3 to Figure 9 (right panels). The darker points represent PHAs with higher populations while the lighter coloured points representing PHAs with lower populations. The solid line is the 1:1 ratio between the EB fitted crude and crude death rate estimates while the dashed line represents mean age-group specific death rate. A similar pattern occurred across all figures, darker points are apparent near the 1:1 line demonstrating minimal shrinkage to the mean death rate. Lighter coloured points, representing PHAs with higher crude rates (to the right of solid line) show greater shrinkage to the mean death rate (the dashed line). PHAs with high crude rates and high populations are also shrunk to the mean but by less than those with lower populations. Comparison between figures shows that the shrinkage towards the mean was higher for younger age groups than for older age groups.
The estimated α and β parameters for the ten years of Premature – Persons death category for each age-group were extracted and then used in Step 2.
Step 2 Use of the ten-year average hyperparameters to create annual EB fitted estimates
For each age-group, the calculated ten-year average hyperparameters are used to adjust the annual age-specific crude rates of death for each PHA using the equation:
EB fitted rate = (Deaths in PHA+ α)/(Population in PHA + α+ β)
Where α, β are the estimated hyperparameters for each age-specific for Premature – Persons death category over the ten years.
Using Premature -Persons deaths in the 35-44 age-group category as an example, the estimated hyperparameters, α and β were 5.9 and 5259. Substituting these values into the above equation, with zero death and population numbers gives a mean death rate of 0.00112 or 112 premature deaths per 100,000 persons for the 35-44 age group category. Table 2 shows the effect of the hyperparameters in shrinking the annual crude death rate towards the mean. For low populations, the calculated crude rates for one or multiple deaths are very high. Applying the hyperparameters, shrinks the two high crude rates towards the mean death rate while keeping the relative magnitude between them. As populations increase, rates are adjusted less towards the mean. However, there is some bias to the mean with larger populations and low numbers of deaths. Importantly though, the relative differences are still maintained. Table 2 also shows the mathematical limits imposed by the hyperparameters on the resultant age-specific EB fitted rates, limiting the variation of EB fitted death rates in the calculation. Here, the EB fitted death rates for one death occurrence in populations that increase from 200 to 1,000 to over 10,000 persons, sees a decrease in rates from 126 to 110 to 45 deaths per 100,000 persons. This change is different in the calculation of crude rates with rates declining from 500 to 100 to 9.8 deaths per 100,000 persons. The EB method also places additional constraints on the estimation of death rates with multiple occurrences in the same age-group category. The estimated rates of one occurrence in small populations (126 deaths per 100,000 persons) is similar to the rate to three occurrences in a larger population (123 deaths per 100,000 persons). This compares to the large relative difference when using the crude rates which were 500 to 150 deaths per 100,000 persons.
| Deaths | Population | Alpha | Beta | Crude EB fitted death rate (per 100,000 persons) | Crude death rate (per 100,000 persons) |
| 1 | 200 | 5.9 | 5,259 | 126 | 500 |
| 6 | 330 | 5.9 | 5,259 | 213 | 1,818 |
| 1 | 1,000 | 5.9 | 5,259 | 110 | 100 |
| 15 | 1,200 | 5.9 | 5,259 | 323 | 1250 |
| 3 | 2,000 | 5.9 | 5,259 | 123 | 150 |
| 23 | 4,527 | 5.9 | 5,259 | 295 | 508 |
| 1 | 10,187 | 5.9 | 5,259 | 45 | 9.8 |
The effect of hyperparameters on the death rates for Premature – Persons deaths in the 35-44 years old age group is shown graphically in Figure 10 (left panel). The points within the figure represent each year of the ten years for each PHA. Similar to Table 1, those PHAs with low population (darker colour) are shrunk to the mean death rate (dashed line). Those PHAs with higher populations (lighter colour) are shrunk less to the mean. Those PHAs near the1:1 vertical line have similar values to the crude rates. EB fitted death rate values below the mean EB fitted death rate show the imposed bias placed on the estimation, with higher EB fitted death rates when compared to the crude death rates. The branching out of estimates graphically along a fairly linear pattern represent PHAs with the same number of death occurrences (the bottom line of values in Figure 10 being one death) with decreasing populations. Therefore, for one death occurrence and decreasing populations (darker coloured points), the crude death rates increase (along the x-axis), as populations get smaller. This issue is minimised with the EB fitted death rate, as rates are shrunk to the mean (dashed line).
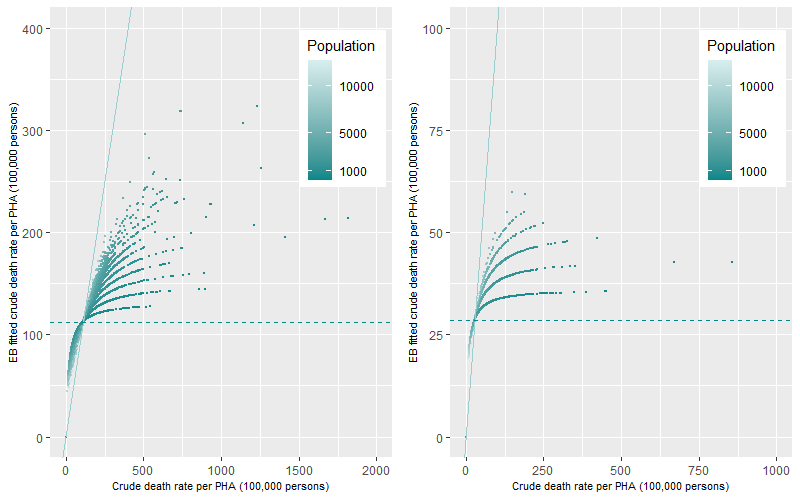
This example shows the hyperparameters for the most prevalent cause of death category. For causes of death that are less prevalent, such as deaths from Premature Cancer in the same age category (35-44 years old), the effect of the hyperparameters on the estimation of the EB fitted death rates will be more dramatic (Table 3). All crude death rates are shrunk towards the mean which was 28.6 deaths per 100,000 persons. The lack of prevalence of Premature Cancer deaths in this age category means that the majority of PHAs will record only one or a small number of multiple death occurrences annually. This is shown graphically in Figure 10 (right panel) as a stepwise linear increase representing an increase in death occurrences from one to seven deaths per PHA annually. This linearity occurs as population decrease (darker coloured points) and the death rates are shrunk towards the mean. The resultant distribution of EB fitted death rates is small between 19 to 59 deaths per 100,000 persons because of the lack of prevalence of Premature Cancer deaths for this age group.
| Deaths | Population | Alpha | Beta | Crude EB fitted death rate (per 100,000 persons) | Crude death rate (per 100,000 persons) |
| 1 | 100 | 3.8 | 13,393 | 36 | 1,000 |
| 2 | 223 | 3.8 | 13,393 | 43 | 897 |
| 1 | 1,000 | 3.8 | 13,393 | 34 | 100 |
| 2 | 1,000 | 3.8 | 13,393 | 41 | 200 |
| 3 | 1,000 | 3.8 | 13,393 | 47 | 300 |
| 1 | 2,000 | 3.8 | 13,393 | 31 | 50 |
| 1 | 5,000 | 3.8 | 13,393 | 26 | 20 |
| 1 | 10,000 | 3.8 | 13,393 | 21 | 10 |
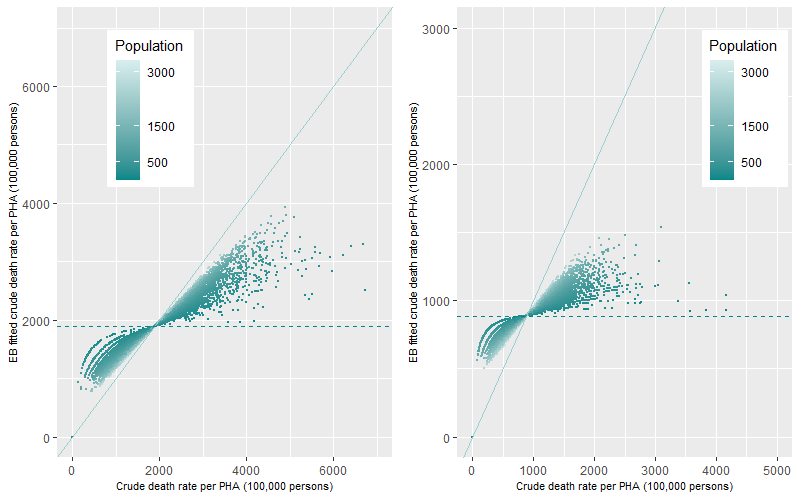
Table 3 and Figure 10 represents an example of the estimation of EB fitted death rates with a low prevalence of death in a younger age group category. Figure 11 shows a comparative example of the estimation of EB fitted death rates for the 65-74 years old age group which has a greater prevalence of death for the Premature – Persons (left panel) and Premature Cancer (right panel) death category. The figure shows similar trends to Figure 10 with death rates for lower populated PHAs being shrunk towards the mean (dotted line) but with less dramatic effects than in Figure 10. Once again, the shrinkage to the mean was more apparent for Premature Cancer (right) than for the Premature death category (left) because of the lower ten-year prevalence of this cause of death in this age-category.
Step 3 Calculation of EB fitted annual death rates by PHA by cause of death
The EB fitted death rate per PHA is the aggregation of all individual age-specific EB fitted death rates which are age standardised to the 2001 population. This is undertaken so that comparisons can be made across time. Standardisation to the 2001 population is achieved by multiplying each age group specific EB fitted death rate by the ratio of the age-group population in 2001 divided by the total 2001 population. These adjusted rates were then aggregated to get an overall EB fitted age-standardised rate per PHA per year. Crude death rates were also age-standardised for comparison. It is important to re-iterate that the overall EB fitted age-standardised death rates for a PHA is the addition of rates across all age-groups. Where each age-specific EB fitted death rate is calculated as the number of deaths divided by the population which is then shrunk towards the corresponding age-specific ten-year mean rate of prevalence.
Comparison of EB fitted age-standardised annual death rates for cause of death with a low and high number of deaths
When the number of deaths is small, for example, for deaths caused by COPD (n=19,286), the mean rates of each age-specific prevalence will be small. This means that annually, the majority of deaths per PHA will also be small with around 56% of all PHAs recording between one to three COPD deaths. This distribution coupled with the age-standardisation process will impose issues in the calculation of the age-standardised death rate. Figure 12 shows the comparison between the EB fitted age-standardised rate and the age-standardised rate for COPD deaths for the ten years of data. For PHAs recording only one death from COPD in a year (top-left), the shrinkage of rates to their age-specific ten-year average is apparent. The five-tier structure in the graph represent five different age groups, the lowest step representing COPD deaths for the 35-44 years old age group and the highest being deaths for the 65-74 years old age group. In comparison to the age-standardised death rates, the rates are much smaller and there now exists little variation in the EB fitted age-standardised death rates. The only significant variation is the differences in the mean EB fitted age-standardised death rates between age groups. It is important to note, that these rates are shrunk significantly to their ten-year age-group average reflecting the overall prevalence of the cause of death in the PHAs over the ten years. Also of note, are the points along the 1:1 line which represent the substitution of the age-standardised death rates for deaths in age-groups where the numbers of deaths were too small (age groups 0-14, 15-24 and 25-34 years old) to be implemented using the ebbr algorithms.
The next three graphs in Figure 12 show the additive nature of the construction of the EB fitted age-standardised death rates for each PHA. Rates for two or more deaths in a PHA annually are calculated in relation to deaths corresponding to either one specific age group or across multiple age groups. If there are multiple deaths in one age-specific category, as in Table 2 and Table 3, there is only a small rise in death rates between one and multiple occurrences. If there are multiple deaths across a number of age-categories, the EB fitted age-standardised death rates increase will be larger than if it occurs in one age-group category because the prevalence of death increases with age (in most cases). The final graph (bottom-right) includes PHAs with COPD deaths of 4 or more, annually. These rates are calculated as above, with deaths in either one specific age group or across multiple age groups. The graph shows the structured nature, with EB fitted age-standardised death rates higher than for PHAs with lower number of deaths. In comparison, age-standardised rates were high for PHAs with one or two deaths indicating the impact of low populations on the calculation of the rate. This influence is now removed from the calculation. The higher EB fitted age-standardised death rates now reflect PHAs with higher number of deaths (four or more annually) rather than PHAs with a small number of deaths in a small population. Comparison of EB fitted age-standardised death rates and the age-standardised death rate show that while the absolute values of the EB fitted age-standardised death rates are lower than the age-standardised death rate there are similar relative magnitudes with high rates being high and low rates being low.
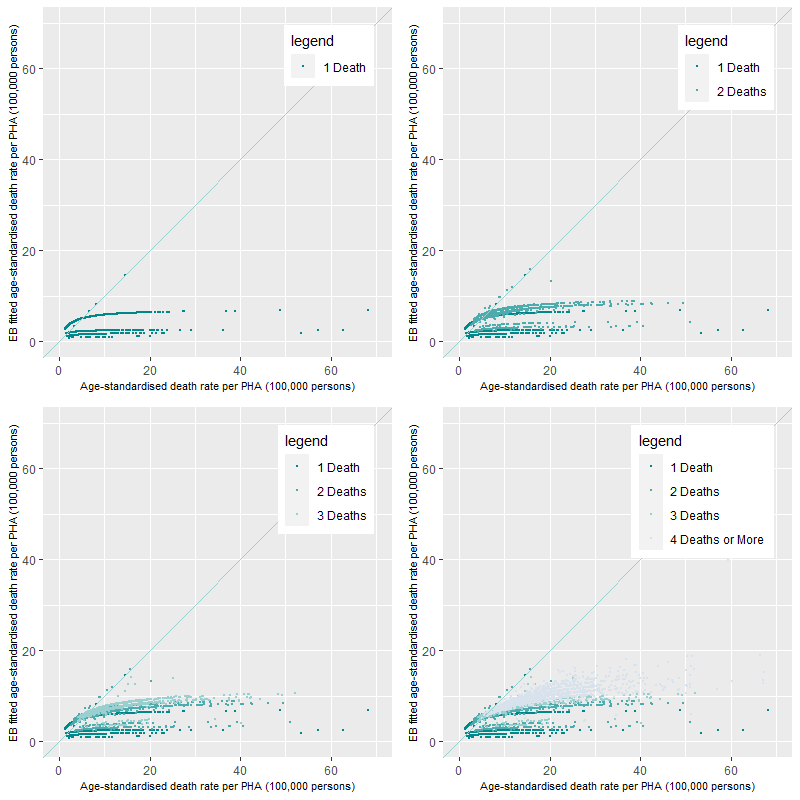
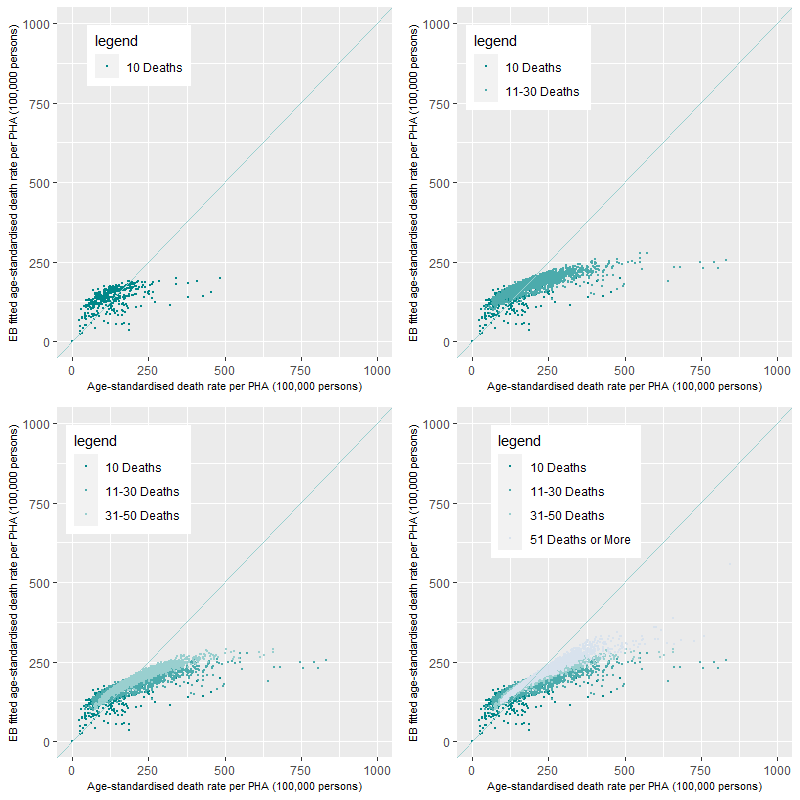
Figure 12 shows the effects on the rate calculations when cause of death prevalence is small. For comparison, Figure 13 shows the comparison of EB fitted age-standardised death rates to age-standardised death rates for the Premature – Persons death category. Once again, some of the high value age-standardised rates are driven by the interaction of a low number of deaths and small populations. This is apparent in the 11-30 Deaths per PHA category where there are age-standardised rates of around 750 deaths per 100,000 persons (top-right). The addition of a higher number of deaths (i.e. the 51 Deaths or more category) in other PHAs shows that the EB fitted age-standardised and age-standardised death rates are fairly comparative not moving substantially from the 1:1 line.
Comparison of the distribution of the EB fitted age standardised rates against the age-standardised death rates
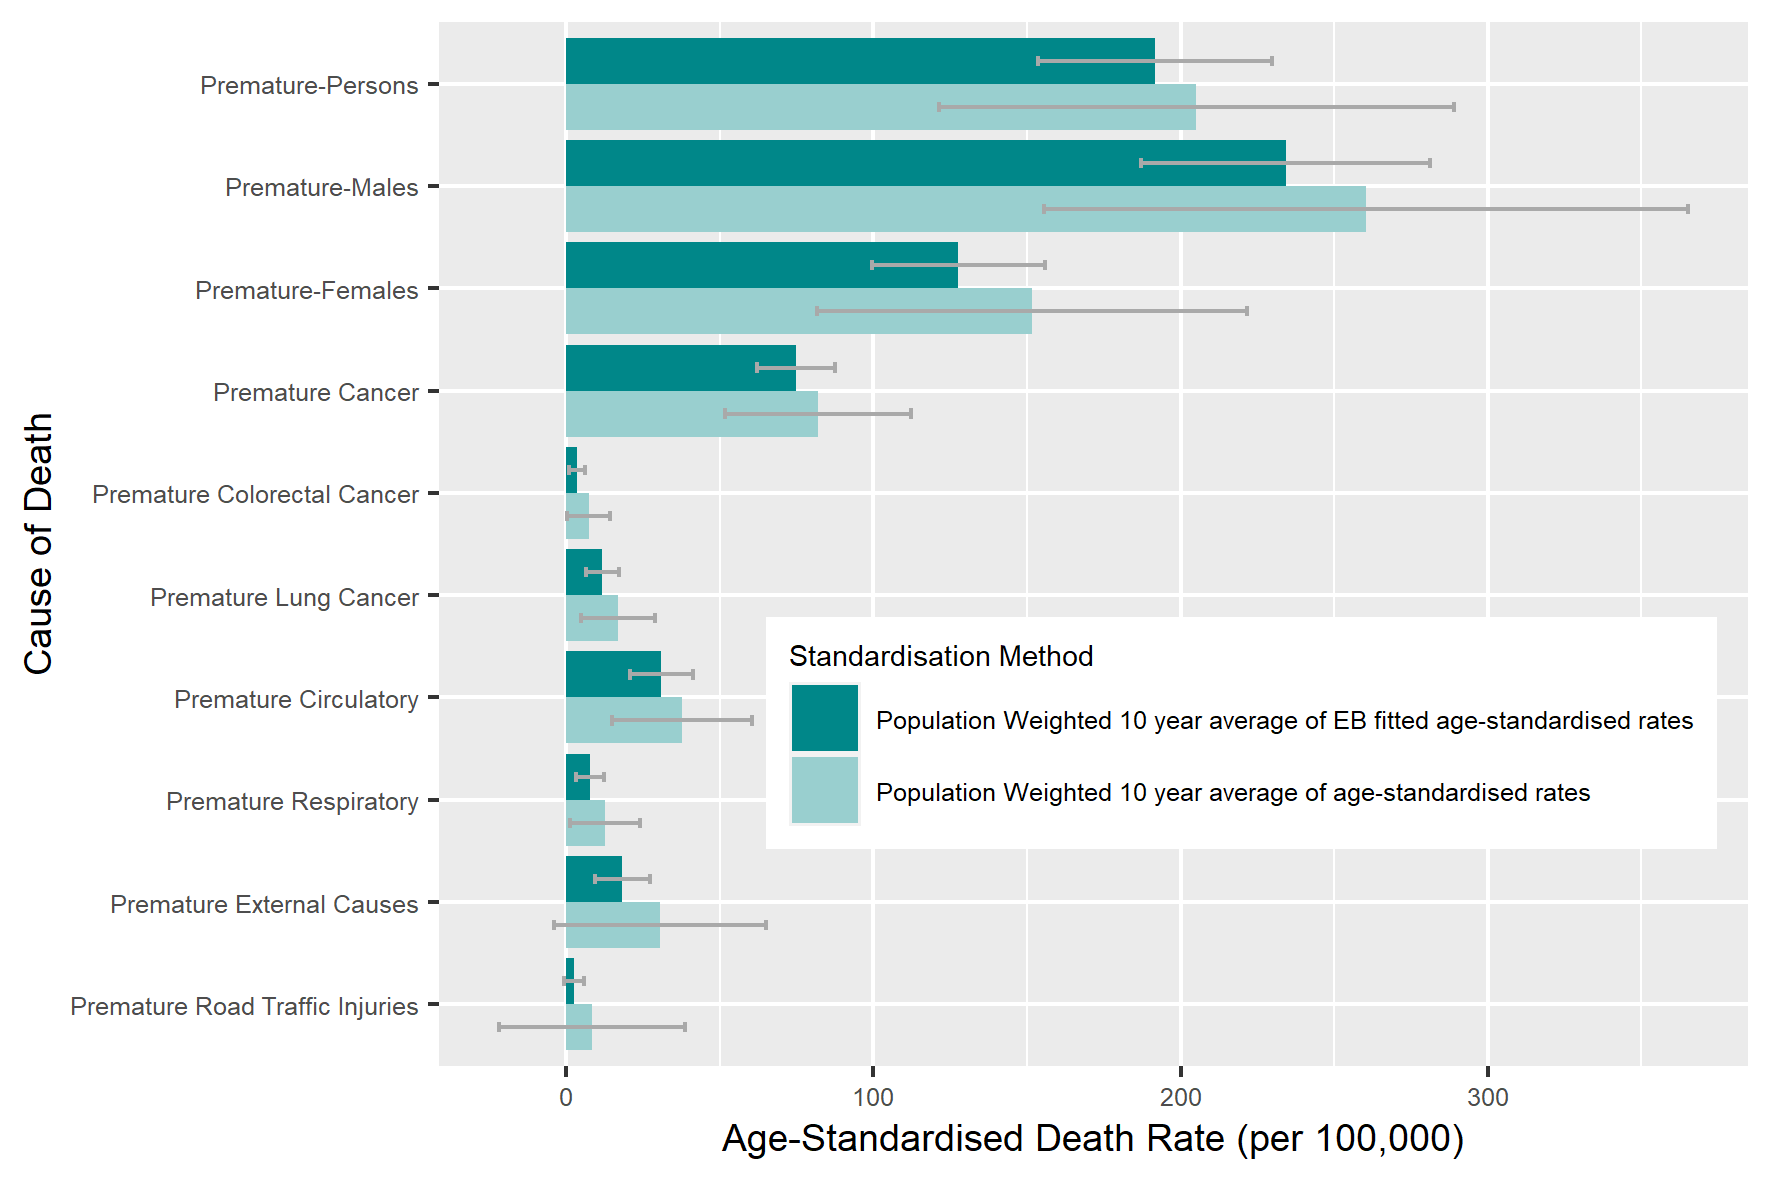
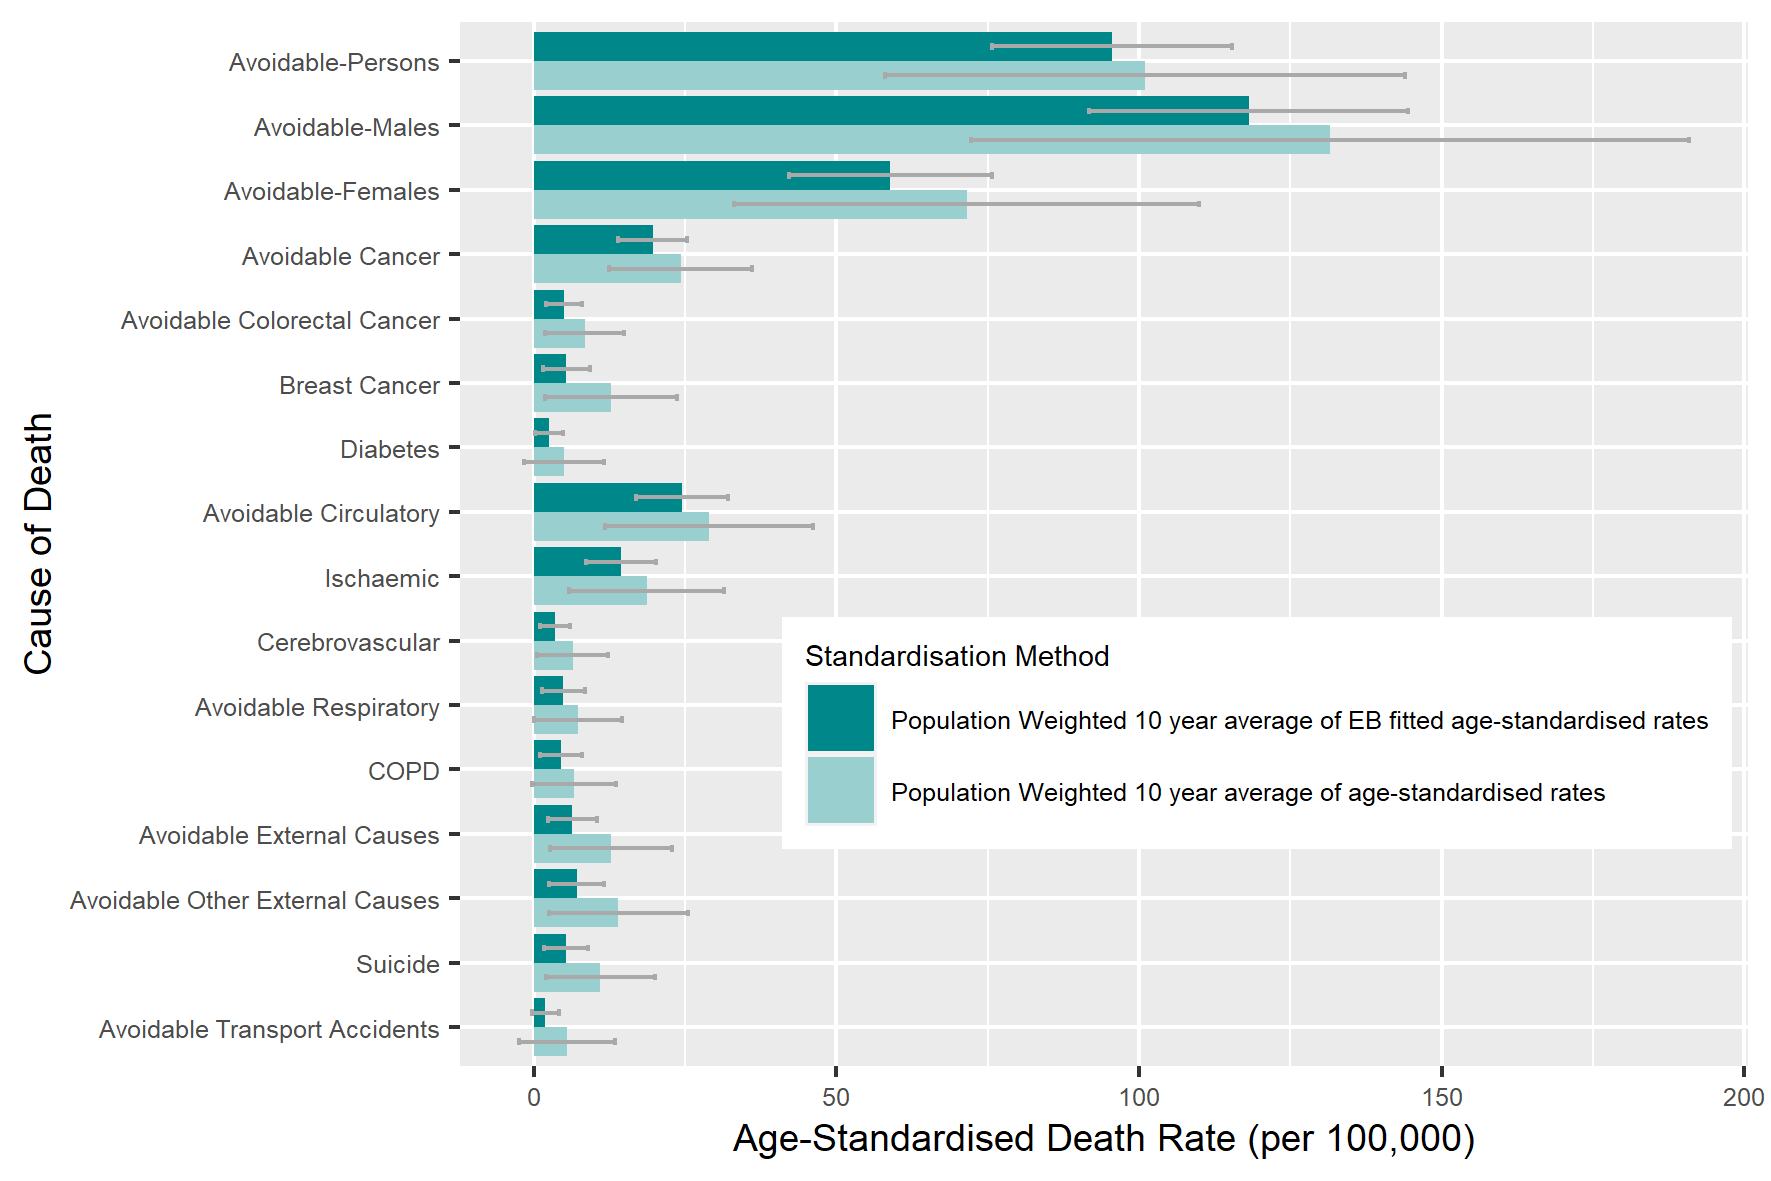
In this section, we compare the population weighted 10 year average and standard deviations of the EB age-standardised and age-standardised death rates across all PHAs (Figure 14 and Figure 15). The figures show the reductions across all causes of death in both the 10 year averages and their corresponding standard deviations when the EB method is used. Of note, is the large standard deviations in some causes of death when the traditional age-standardisation method is implemented. This large amount of variation induced by this method in the calculation of the death rates will make the identification of PHAs with large death rates problematic.
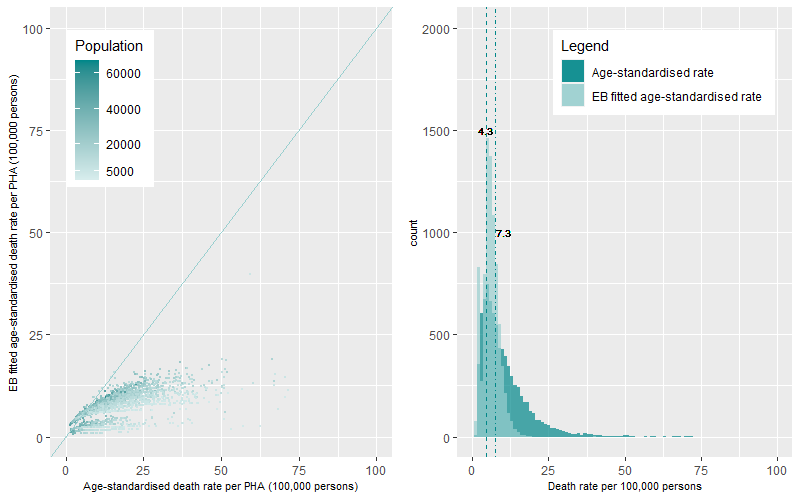
For a final comparison of death rates, we compare the distributions of the annual EB-fitted age-standardised and the annual age-standardised death rate for the PHAs over the ten years using a both a scatter plot and histogram. Below are the examples for the COPD and Premature – Persons death categories. A comprehensive list by causes of death is available here
Figure 16 (left panel) shows the scatterplot of the rate distributions for COPD deaths by population while Figure 16 (right panel) shows the histogram of the rate distributions. Both plots show that the age-standardised death rates for COPD are positively skewed with long tail of outlying high rates. The average age-standardised death rate for COPD per PHA was 7.3 deaths per 100,000 persons over the ten years. The distribution of the EB fitted age-standardised death rates for COPD now shows a bimodal dynamic of the distribution with a group of PHAs with very low annual rates of death and a large group of PHAs with higher rates. The average EB fitted age-standardised death rate for COPD per PHA was estimated at 4.3 deaths per 100,000 persons.
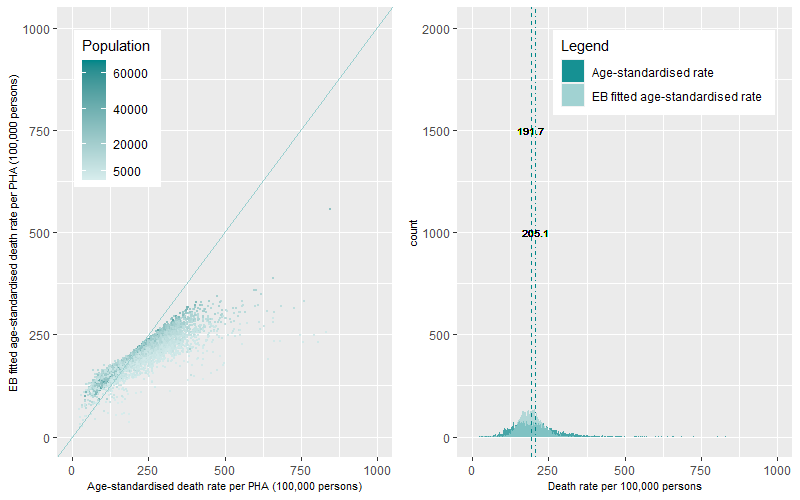
For the Premature – Persons death category (Figure 17), the age-standardised mean death rate for Premature – Persons deaths was 205.1 deaths per 100,000, this compares to a lower average EB fitted age-standardised mean death rate of 191.7 death per 100,000 persons. The dynamics of the distribution of the EB fitted age standardised death rates shows a much more peaked and tighter distribution when compared to the distribution of age-standardised death rates which report a flatter distribution with a larger number of outliers. Of note, is the outlying PHA, top right of the left panel, which has a high death rate using the two methods. This suggest some degree of internal data consistency.
Some cautionary notes
We conducted an Empirical Bayes approach to estimate death rates at the PHA small area level across Australia. We undertook this to remove the influence of small numbers (both deaths and populations) on the calculation of annual PHA death rates. In general, we cannot easily distinguish between what is the true death rate of a PHA, what variation is caused by statistical issues and what is the degree of over smoothing or bias that is imposed by the EB methodology.
The major benefit of the EB methodology is that it provides a conservative estimate of the mortality rate, specifically reducing high outlier death rates which are high when a very small number of deaths occur randomly in a PHA and when age-specific populations are low. This is highlighted in the worked example in Table 2 and Table 3 and this will affect the robustness of EB method estimating the death rate. For example, for the cause of death categories which have large numbers of deaths such as the Premature – Persons death category (n=514,710 deaths), the difference between the age-standardised and the EB fitted age-standardised death rates are low. Nearly, 43% of the EB fitted death rates differ by ±10% and 76% of the values differed by ±20% when compared to the age-standardised death rates. However, for those causes of deaths with lower numbers of deaths, such as female breast cancer deaths (n=17,194 deaths), the difference between the EB fitted age-standardised death rates and the age-standardised death rate was high with over 70% of the values between 20-75% less than the age-standardised rate. These examples represent opposite ends of the spectrum with Premature – Persons deaths having a large number of deaths and large populations in comparison to the female breast cancer death category which have fewer deaths and is only calculated for the female populations (by age-group) in each PHAs. We therefore suggest that caution be used for those causes of death where low numbers of deaths occur.
Hot-spot analysis – Identifying the geographic variation and temporal persistence of death hot spots across Australia
We now have estimates of annual rates of death for each PHA which have been adjusted for known statistical issues. To identify the geographic and temporal persistence of high rates of death we undertook four steps:
- The first step involved deriving ratios between the annual EB fitted death rates by PHA by cause of death to their corresponding annual Australian average of the EB fitted death rates. For example, values of 0.5 or 1.5 meant a rate that was 50% lower or 50% greater than the Australian rate while values of 2 or 3 meant rates were two to three times greater than the Australian rate.
- The second step compared these ratios to a range of thresholds. This was undertaken to understand the sensitivity of the death rates within the PHA for each year and discern the disparities between PHA. A total of 20 thresholds were selected with the lowest threshold set to 50% of the Australian rate and the highest set to four times the Australian rate for each year. We recorded a value of one, when the ratio was higher than each threshold while a value of zero was recorded when it was lower over the ten years of analysis.
- In the third step we aggregated the ten years into a ten-digit code for each PHA by cause of death categories. This created unique codes of when the PHA was either above or below a chosen threshold for the ten years, as a whole. The codes were then classified into five categories; Cold, Cold-Warm, Warm, Warm-Hot and Hot based on a set of aggregation rules.
- This fourth step produced a dataset summarising the heat of cause of death categories by PHA and threshold. This information was used for input into the interactive web-based maps and heat map graphs
The benefit of using the EB fitted age-standardised death rates versus the age-standardised death rates in the hotspot analysis
The benefit of using the EB fitted age-standardised methodology over the traditional age-standardisation is that it minimises the effects of statistical issues in the calculation of the age-standardised death rates. These statistical issues produce high rates for PHAs that in reality, due to low numbers present in the calculation, may not be reliable indicators high. This issue complicates efforts to identify and then target those PHAs of greatest concern for future interventions.
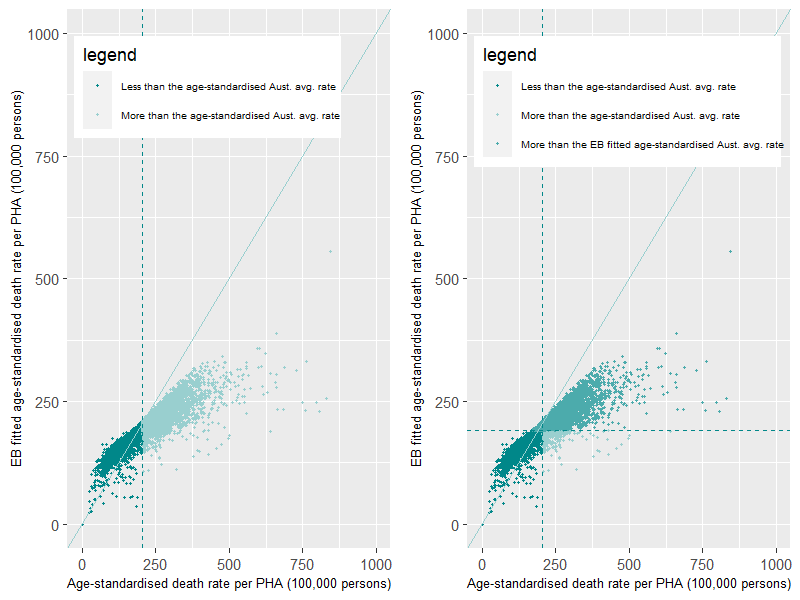
To illustrate the benefit of the EB methodology in identifying PHAs with high rates, we compare the distribution of PHAs selected from the age-standardised and EB fitted age-standardised methodologies when compared to the Australian average threshold for the Premature – Persons death category (Figure 18). The selection of PHAs with rates above the threshold, highlighted as light green points, are shown in Figure 18– left panel using the age-standardisation method. The vertical dashed line is the Australian average rate produced by the age-standardisation method. The selection of PHAs from the EB fitted age-standardised method is then overlain on top of this distribution (Figure 18– right panel). The horizontal dashed line is the Australian average rate produced by the EB methodology. This distribution highlights the identification of PHAs common to both methods for the chosen threshold, shown in the top right quadrant of the figure. It also highlights those PHAs that would not be identified under both methods. The top left quadrant highlights a small amount of PHAs identified under the EB but not identified under the age-standardised methodology. We have some confidence in the statistical robustness of these rates as they have fairly large populations (Figure 17-left panel) and the actual values of the standardised rates are comparable under both methodologies (near the 1:1 line). Alternatively, the bottom right quadrant identifies a number of PHAs identified as above the threshold using the age-standardisation and not the EB fitted age-standardisation methodology, identified by the points with the lightest green colour. Some of these PHAs have smaller populations (Figure 17-left panel) and have EB fitted rates that have been reduced significantly from their age-standardised comparison rates. These PHAs, under this chosen threshold and age-standardisation methodology, have been falsely identified as having rates over this threshold due to the occurrence of small numbers in the overall age-standardisation calculation.
Some general results
Hotspot differences for the Premature – Persons and Avoidable – Persons death categories by Australian State and Territory
There is a large variation in the number of hotspots identified across Australia. This variation differs by geographic location and by cause of death category. For the broad causes of death categories, the premature and potentially avoidable death categories, around 37% and 34% of all PHAs across Australia were classified as “Hot” i.e. those areas that had death rates consistently over the Australian average for the 10 years of data investigated (Figure 19 and Figure 20).
The distribution of PHAs within each state and territory that are classified as “Hot” and “Cold” by the Premature – Persons and Avoidable – Persons death categories for a range of thresholds are shown below. A comprehensive list for each cause of death is available here
Premature – Persons
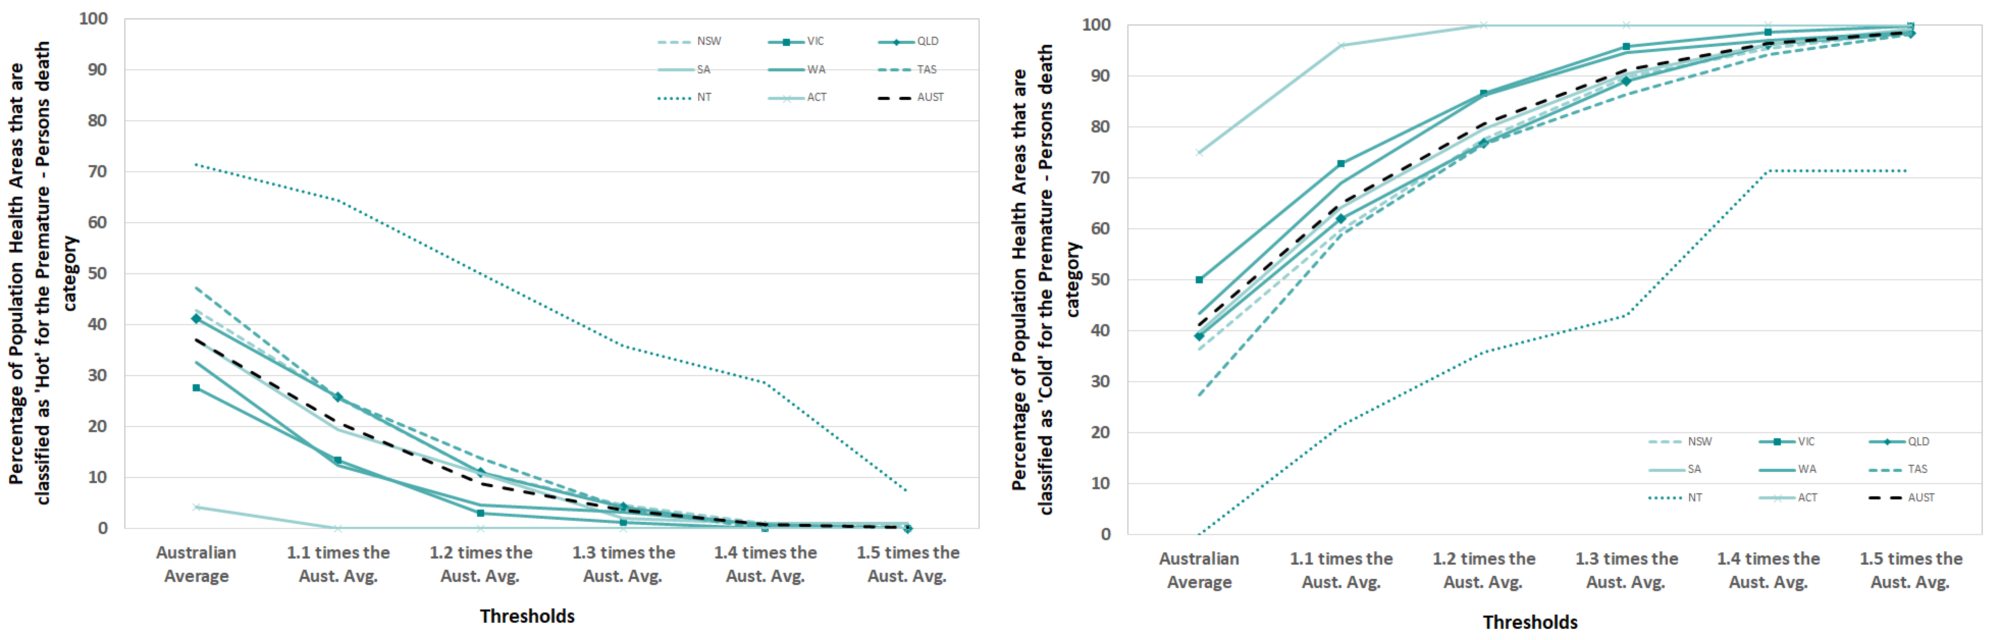
The percentage of PHAs within each state or territory that are consistently, across all ten years, above (“Hot”) or below (“Cold”) the EB fitted Australian rate of deaths for the Premature – Persons death category are shown in Figure 19. The classifications represent the two extremes on the heat classification spectrum. The percentage of PHAs that were classified as “Hot” within a state or territory were by far the highest in the Northern Territory (NT), followed by a group of states; Tasmania (TAS), New South Wales (NSW) and Queensland (QLD). This classification represented over 70% of PHAs in the NT and between 28% and 48% of PHAs for the other states for the above the Australian Average threshold. As the thresholds increase the percentage of PHAs that are “Hot” decrease. At threshold 1.4 times the Australian average rate the percentage of PHAs classified as “Hot” reaches zero, except for the NT. The percentage of Population Health Areas that were classified as “Cold” within a state or territory were highest in Australian Capital Territory (ACT). This is followed by all states except the NT. This represented 75% of PHAs in the ACT, 50% of PHAs in Victoria and around 28% in TAS for the above Australian Average threshold. No PHAs in the NT were classified as “Cold” for this threshold. As the thresholds increase the percentage of PHAs that are “Cold” increase within all states and territories, reaching over 90% of PHAs by the 1.4 times the Australian average threshold. This occurs in all regions except for the NT.
If we take the example of Victoria (VIC) in Figure 19, we can see that 28% of PHAs are classified as “Hot” at the Australian average. At the opposite end of the classification spectrum, we can see that 50% of PHAs are classified as “Cold” at the Australian average. Therefore, the majority (78%) of PHAs sit in these two classifications with 15% or fewer PHAs distributed within the “Cold-Warm”, “Warm” and “Warm-Hot” heat categories.
Once again, it is important to mention that the EB methodology has shrunk the variation and therefore the statistical range of death rate estimates for the Premature-Persons death category. This is evident with only four thresholds being used before either zero or over 90% of PHAs being reached.
Avoidable – Persons
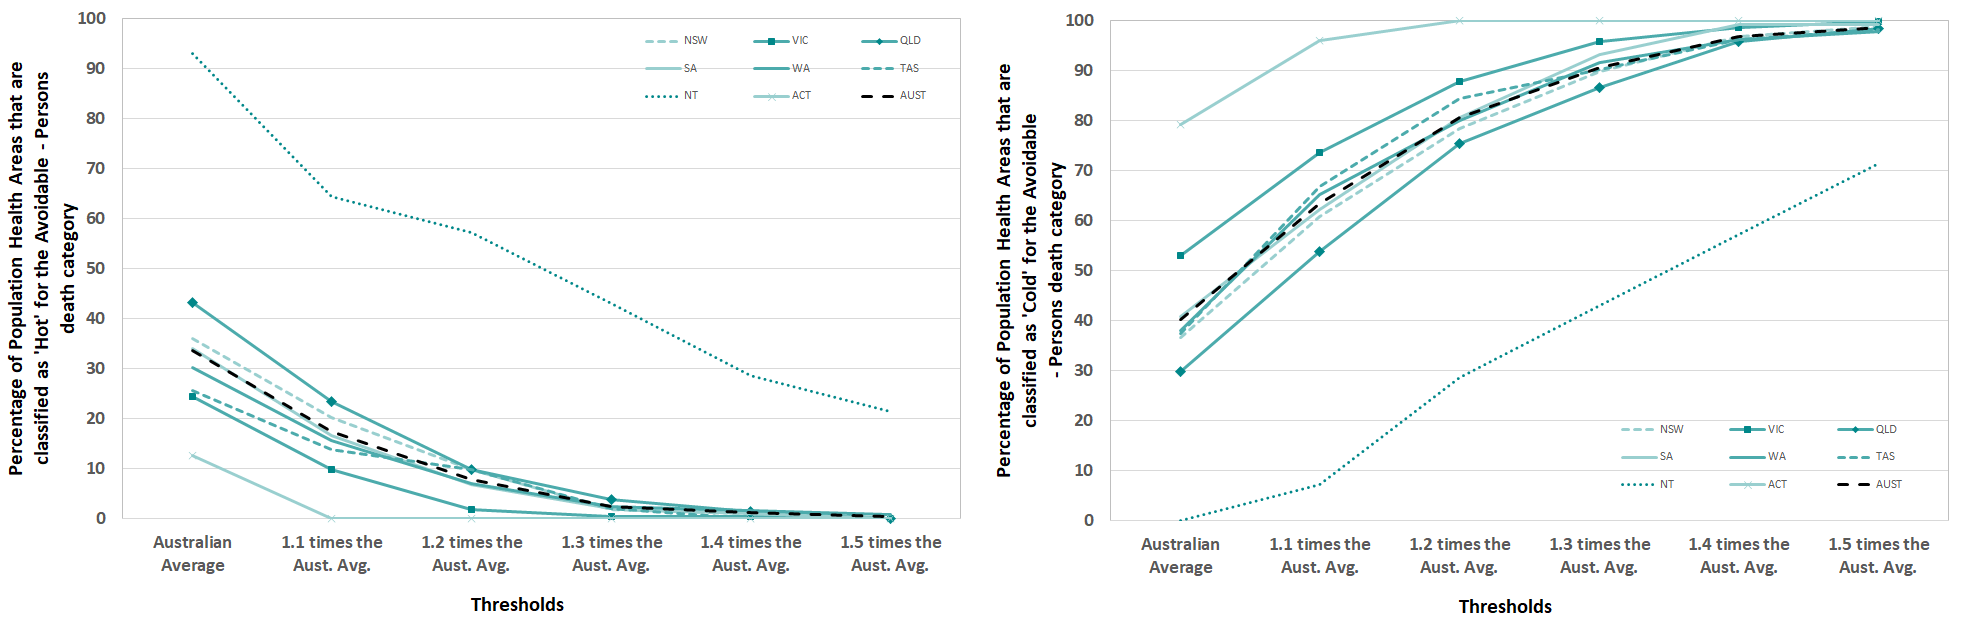
The percentage of PHAs within each state or territory that are consistently, across all ten years, above (“Hot”) or below (“Cold”) the selected thresholds for the Avoidable – Persons death category are shown in Figure 20. The percentage of Population Health Areas that were classified as “Hot” within a state or territory were by far the highest in the NT. This was followed QLD and to a lesser extent, NSW. For this death category which represents deaths that can be seen as avoidable, over 90% of PHAs in the NT are classified as “Hot”. These PHAs are always over the Australian Average threshold for the ten years of data. In comparison, the other states are between 25% and 42% of PHAs. As the thresholds increase the percentage of PHAs that are “Hot” decrease to zero, except for the NT. The percentage of PHAs that were classified as “Cold” within a state or territory were highest in the ACT followed by VIC. This represented nearly 80% of PHAs in the ACT and over 50% of PHAs in VIC. As the thresholds increase the percentage of PHAs that are “Cold” increase with all states and territories.
Hotspot differences for selected cause of death across Australia
Table 4 shows the number of PHAs across Australia that are classified as “Hot”, "Between Hot and Cold" and “Cold” by the Above Australian Average, 30% and 50% more than the Australian Average thresholds. There is some variation in the numbers of “Hot” and “Cold” PHAs by cause of death. As the thresholds are increased, the influence of the EB methodology is apparent with only a small number of PHAs classified as “Hot” under the 50% more than the Australian Average threshold. This is caused by the shrinkage in the statistical range of EB fitted death rates. However, there are some causes of death which have a notable number of PHAs classified as “Hot’ under this high threshold, for example, deaths from respiratory diseases and road traffic injuries.
| Cause of death category | Above Australian Average | 1.3 times the Australian Average | 1.5 times the Australian Average | ||||||
| Hot | Between Hot and Cold | Cold | Hot | Between Hot and Cold | Cold | Hot | Between Hot and Cold | Cold | |
| Premature - Persons | 428 | 259 | 478 | 41 | 67 | 1,057 | 3 | 18 | 1,144 |
| Avoidable – Persons | 390 | 310 | 465 | 28 | 85 | 1,052 | 4 | 18 | 1,143 |
| Premature – Males | 402 | 292 | 471 | 24 | 55 | 1,086 | 1 | 11 | 1,153 |
| Avoidable – Males | 356 | 364 | 445 | 23 | 86 | 1,056 | 0 | 14 | 1,151 |
| Premature - Females | 342 | 357 | 466 | 15 | 43 | 1,107 | 1 | 6 | 1,158 |
| Avoidable - Females | 327 | 433 | 405 | 23 | 110 | 1,032 | 5 | 17 | 1,143 |
| Premature Cancer | 344 | 456 | 365 | 1 | 7 | 1,157 | 0 | 4 | 1,161 |
| Avoidable Cancer | 285 | 503 | 377 | 0 | 40 | 1,125 | 0 | 4 | 1,161 |
| Premature Colorectal Cancer | 172 | 543 | 450 | 61 | 407 | 697 | 14 | 290 | 861 |
| Avoidable Colorectal Cancer | 186 | 557 | 422 | 63 | 425 | 677 | 10 | 280 | 875 |
| Premature Lung Cancer | 398 | 491 | 276 | 26 | 246 | 893 | 2 | 29 | 1,134 |
| Female Breast Cancer | 95 | 476 | 594 | 68 | 417 | 680 | 33 | 358 | 774 |
| Diabetes | 261 | 561 | 343 | 114 | 380 | 671 | 70 | 302 | 793 |
| Premature Circulatory | 346 | 415 | 404 | 38 | 142 | 985 | 8 | 29 | 1,128 |
| Avoidable Circulatory | 355 | 425 | 385 | 39 | 147 | 979 | 4 | 33 | 1,128 |
| Ischaemic Heart Disease | 333 | 472 | 360 | 50 | 264 | 851 | 11 | 72 | 1,082 |
| Cerebrovascular | 277 | 620 | 268 | 91 | 445 | 629 | 31 | 313 | 821 |
| Premature Respiratory | 335 | 491 | 339 | 100 | 326 | 739 | 35 | 156 | 974 |
| Avoidable Respiratory | 336 | 532 | 297 | 152 | 402 | 611 | 74 | 304 | 787 |
| Chronic Obstructive Pulmonary Disease (COPD) | 348 | 519 | 298 | 151 | 421 | 593 | 79 | 321 | 765 |
| Premature External Causes | 286 | 409 | 470 | 68 | 261 | 836 | 13 | 129 | 1,023 |
| Avoidable External Causes | 197 | 479 | 489 | 66 | 322 | 777 | 23 | 217 | 925 |
| Avoidable Other External Causes | 201 | 506 | 458 | 73 | 341 | 751 | 29 | 223 | 913 |
| Suicide | 200 | 478 | 487 | 56 | 362 | 747 | 26 | 232 | 907 |
| Premature Road Traffic Injuries | 162 | 584 | 419 | 85 | 458 | 622 | 63 | 357 | 745 |
| Avoidable Transport Accidents | 141 | 557 | 467 | 93 | 460 | 612 | 69 | 376 | 720 |
Issues associated with the potentially avoidable death indicators
The potentially avoidable death indicators have two potential uses.
The first, and the primary use in this project is as a population health indicator, an indicator of a population’s health and safety. The outputs of the analysis demonstrate that there are areas of inequality in the causes of death and these occurrences happen consistently over time.
The second, is the use of the potentially avoidable death indicator as formal performance indicator to measure the delivery of health services in the Australian health performance framework. There are several issues using this indicator in this way as the indicator can be influenced by a variety of factors reflecting influences other than changes in the provision of health care. Falster and Jorm, 2017 highlight that these issues influence the interpretability of the indicator and therefore any direct influence from specific health policies (such as introduction of new models of care), practice (such as new effective treatments) or interventions have on reducing potentially avoidable deaths.
Falster and Jorm, 2017 suggest that policymakers in their interpretation of the indicator need to utilise their experience and knowledge at the local level to better understand the priority areas and issues faced within their region. These specifically are:
- changes in disease incidence would lead to a change in corresponding deaths for that condition without any potential change in the quality of treatment or care provided for those with that disease. Similarly, a decrease in mortality rates for a specific condition may reflect a decrease in disease incidence, rather than an increase in people surviving with the condition because of appropriate care.
- data quality issues in regards to the use of different disease coding systems (e.g. International Classification of Diseases versions 9 ,10 and 11 in the near future) and changes in disease coding technology, such as the introduction of automated coding
- data quality issues in regards to cause of death codes as codes such as suicide are updated retrospectively reflecting the findings of coronial investigations and potentially affect the total number of deaths per year
- data quality issues in regards to how representative the final single death code is of the cause of death. This uncertainty can cast doubt on whether the death was avoidable or an alternative other cause of death which were avoidable but due classification error were not included in the indicator.
- the indicator is reviewed and updated by health policymakers to reflect deaths that are relevant to the current health care system, at the time in which it is being measured. The development of new treatments, interventions and screenings mean that an avoidable cause of death today may not have been avoidable in the recent past. This may make comparison of avoidable deaths over time difficult.
- Interpretation of the indicator is difficult as there will be no single principle that characterises the mechanisms by which mortality for these causes can be avoided. These could be differences in; socioeconomic status of individuals and of areas, lifestyle risk factors, chronic conditions, the ability to afford care and remoteness from services or broader public health policies currently outside the scope of the indicator.
Authored by PHIDU